

Key Takeaways
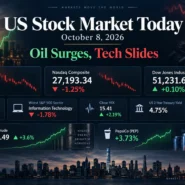
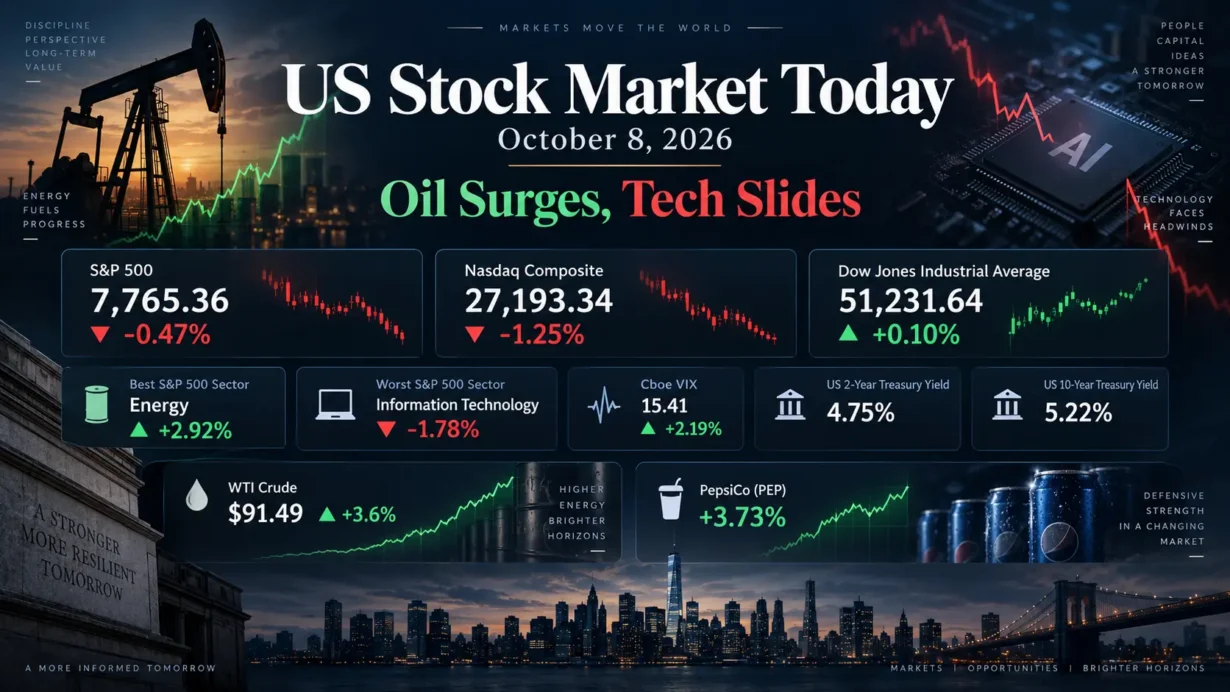
- At the 4:00 p.m. ET regular-session close on October 8, 2026, the S&P 500 finished at 7,765.36, down 0.47%; the Nasdaq Composite fell 1.25% to 27,193.34; and the Dow Jones Industrial Average gained 0.10% to 51,231.64.
- Energy led S&P 500 sectors with a 2.92% gain, while information technology lost 1.78%. Roughly two-thirds of S&P 500 constituents advanced, revealing substantial strength beneath the headline decline.
- Treasury’s daily reference yields fell to 4.75% for two years and 5.22% for 10 years, even as initial jobless claims declined to 197,000. The combination offers little support for assuming an imminent policy easing.
- PepsiCo gained 3.73% despite lowering its earnings growth outlook, highlighting the market’s selective response to earnings visibility and prospective cost reductions.
1. Market Capital Flows and Sector Rotation
Energy’s 2.92% advance and technology’s 1.78% decline framed the session. Consumer staples gained 2.12% and financials rose 0.91%, while consumer discretionary fell 0.47% and utilities slipped 0.26%. Cyclical and defensive sectors both showed dispersion: the market favored particular earnings exposures rather than buying either group indiscriminately. These figures refer to S&P 500 sector indexes.
Small caps held up better than the large-cap S&P 500: the Russell 2000 added 0.92 points to 2,794.13, approximately 0.03%. Among S&P 500 style ETF proxies, growth fund SPYG fell 1.23%, while value fund SPYV gained 0.63%. Those are ETF price returns, which provide a consistent comparison of the day’s value-over-growth tilt.
About two-thirds of S&P 500 stocks rose, despite the index’s loss. Reuters linked semiconductor weakness to press scrutiny of OpenAI’s revenue disclosures. Together, these observations support an interpretation of concentrated technology pressure and selective rotation; they do not establish market-wide institutional selling.
Institutional Flow Insight: An institution seeking to reduce dependence on AI earnings assumptions could favor businesses with nearer-term cash flows and more visible demand. Energy adds sensitivity to commodity prices; staples offer steadier consumption, but remain exposed to input costs. Technology’s weakness despite afternoon yield relief suggests earnings confidence mattered alongside valuation. These are allocation inferences. Price changes alone cannot establish fund flows, changes in risk budgets or quarter-start rebalancing.
2. Decoding the Biggest Market Movers
PepsiCo (PEP)
PepsiCo closed at $128.34, up 3.73%. Its official third-quarter release, covering the 12 weeks ended September 5, reported revenue of $25.274 billion, up 5.6%, and organic revenue growth of 3.1%. GAAP diluted EPS was $2.23; core, non-GAAP EPS was $2.34. Consolidated core operating margin declined 35 basis points to 16.9%.
Management cut its fiscal 2026 core constant-currency EPS growth guidance to 1%–2%, from the low end of 4%–6%. This is the company’s outlook, not realized earnings. Its prepared remarks showed international organic revenue growth of 8%, alongside margin pressure in North American foods and beverages. Management also outlined additional corporate and discretionary cost reductions to fund growth investments and address input inflation.
The rally is consistent with investors valuing international momentum and the prospect of stronger cost control, although trading data cannot confirm that motivation. The sector implication is selective: a staples business can sustain demand while spending more to generate it. Peer valuations therefore depend on the durability of margins and cash generation, and a favorable stock reaction does not establish a completed operating recovery.
Source note: PepsiCo’s official IR page listed the earnings release and prepared management remarks, but no third-quarter investor Q&A transcript when checked. The company analysis above uses those official written disclosures.
3. Macro Indicators and Market Outlook
At its 4:15 p.m. ET close, the Cboe VIX finished at 15.41, up 0.33 points, or 2.19%. Higher implied volatility alongside weaker major indexes is consistent with some increase in protection demand or event uncertainty. That modest move alone cannot identify institutional option buying or establish disorderly liquidation.
On Treasury’s official daily par curve, the two-year yield declined 2 basis points to 4.75% and the 10-year fell 6 basis points to 5.22%, compared with October 7. These observations use indicative prices at or near 3:30 p.m. ET. The calculated 2s10s spread narrowed from 51 to 47 basis points, a bull flattening. The larger long-end decline reduced discount-rate pressure, but cannot separately identify changes in expected policy rates, growth, inflation compensation and term premium.
Initial unemployment claims were 197,000 for the week ended October 3, down 2,000 from the revised prior-week level of 199,000. That signals subdued layoffs, without proving strong hiring. In an October 8 speech, Fed Governor Christopher Waller said additional rate increases could be appropriate if the data evolved as expected, with flexibility over timing. The afternoon bond rally therefore offered insufficient evidence of a Fed pivot.
Oil supplied the clearest cross-asset explanation for sector leadership: WTI settled at $91.49 a barrel, up 3.6%, and Brent at $104.28, up 4.1%. Reuters cited Middle East supply concerns and storm disruption; an official offshore update documented production shutdowns related to Isaias. Higher crude can support upstream earnings while squeezing fuel-intensive businesses and household purchasing power. Producers with interrupted output may capture less of that benefit.
Upcoming Economic Data & Catalysts:
- University of Michigan Preliminary October Surveys of Consumers (Release date: October 9, 2026, at 10:00 a.m. ET): Watch household confidence and inflation expectations for evidence of how higher energy costs are affecting spending intentions and perceived inflation persistence.
- U.S. Consumer Price Index for September (Release date: October 14, 2026, at 8:30 a.m. ET): Headline and core inflation, shelter costs and the breadth of price increases will help test the inflation outlook and the pressure on equity discount rates.
Market Insights:
The closing pattern points to concentrated weakness in technology, with broader participation elsewhere. Its durability depends on whether improving breadth can survive another rise in yields or a reduction in earnings expectations. A useful test is whether growth stocks stabilize when bonds rally. Continued technology weakness under those conditions would strengthen the case that earnings and valuation concerns are driving the adjustment.
Trading & Investment Strategy:
Review overlapping technology exposures across funds, keep positions within established risk limits and stage new purchases. Favor demonstrable cash generation and manageable financing needs when selecting companies within energy, staples and other sectors. Avoid chasing an oil-driven surge without assessing production exposure and valuation. Set exit rules around thesis failure and acceptable portfolio loss; size positions for gaps that can carry prices beyond stop levels.
4. Key FAQs About the US Stock Market Today
Why did the US stock market move on October 8, 2026?
Technology selling tied to concerns about AI revenue visibility weighed on the S&P 500 and Nasdaq. Higher oil supported energy while adding inflation risk. Treasury yields reversed lower, helping explain why broader stocks held up, and PepsiCo illustrated the selective response to corporate earnings.
Which sectors performed best and worst in the US stock market on October 8, 2026?
Energy was the strongest S&P 500 sector, rising 2.92%; information technology was the weakest, falling 1.78%. The pattern combined improved oil-linked earnings prospects with greater scrutiny of technology’s earnings assumptions.
What should investors watch after the US stock market close on October 8, 2026?
The next scheduled tests are Michigan’s preliminary consumer survey on October 9 and September CPI on October 14. Monitor Treasury yields, continued participation outside technology and whether corporate guidance supports margins after higher input costs. None of these signals guarantees the market’s next direction.
Disclaimer: This article is intended solely for the exchange of investment ideas and does not constitute investment advice of any kind.