Key Takeaways
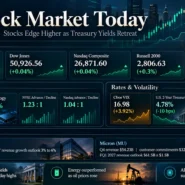
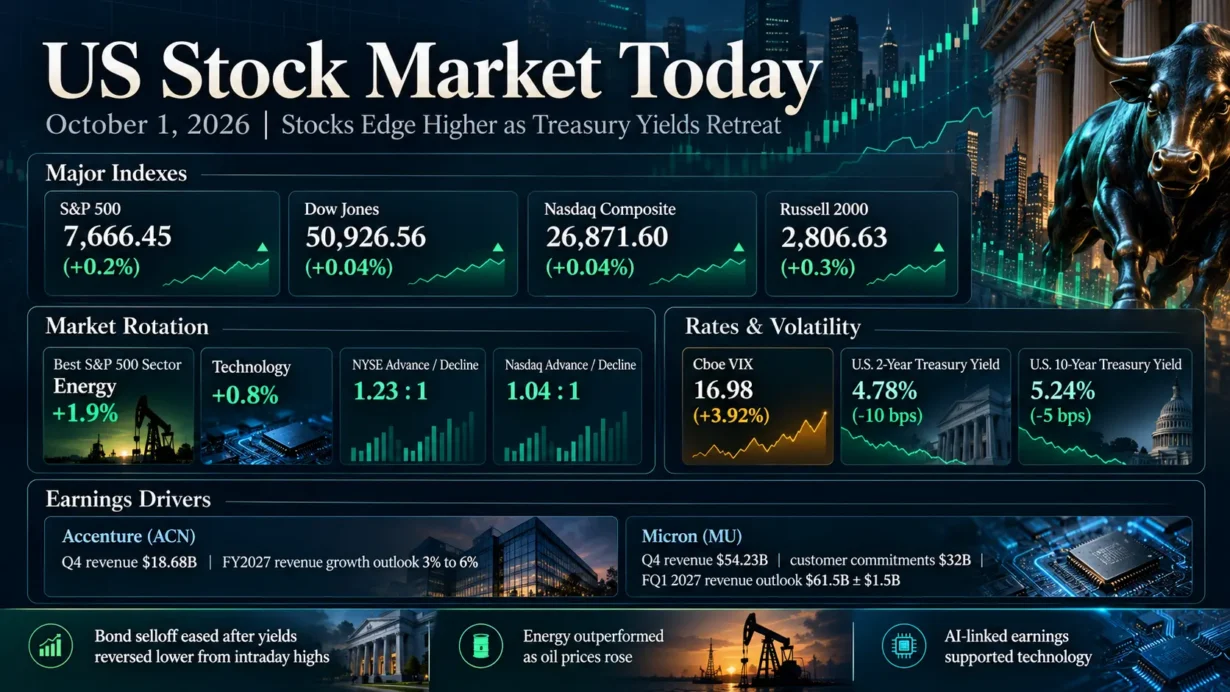
- The S&P 500 closed at 7,666.45, up 0.19%, while the Dow Jones Industrial Average gained 0.04% to 50,926.56, the Nasdaq Composite rose 0.04% to 26,871.60, and the Russell 2000 advanced 0.35% to 2,806.63.
- A sharp intraday reversal in Treasuries helped stabilize equities: the official U.S. Treasury closing curve showed the 2-year yield at 4.78%, down 10 basis points from September 30, and the 10-year at 5.24%, down 5 basis points.
- Energy led the S&P 500 sectors with a 1.92% gain as oil prices jumped, while Health Care fell 1.30% and Communication Services declined 1.19%, underscoring a selective rather than broad-based risk-on session.
- Accenture surged 15.78% after fiscal fourth-quarter revenue topped the company’s own guidance range and management issued its fiscal 2027 outlook, while Micron gained 3.03% after reporting record fiscal fourth-quarter results and issuing fiscal first-quarter guidance.
- September ISM Manufacturing remained in expansion at 54.5, but the Prices Index jumped to 77.9. Initial jobless claims were 197,000, reinforcing a mix of resilient growth and persistent inflation sensitivity ahead of the October 2 jobs report.
1. Market Capital Flows and Sector Rotation
The headline index gains understated the degree of rotation beneath the surface. Five of the 11 S&P 500 sectors finished higher. Energy led with a 1.92% gain, followed by Industrials at 1.00%, Information Technology at 0.76%, Utilities at 0.61%, and Financials at 0.16%. On the downside, Health Care lost 1.30%, Communication Services fell 1.19%, Real Estate declined 0.62%, Materials slipped 0.45%, Consumer Staples fell 0.29%, and Consumer Discretionary eased 0.15%. The Russell 2000’s 0.35% advance modestly outpaced the S&P 500, while the Nasdaq’s 0.04% gain lagged, suggesting the session was not simply another mega-cap growth squeeze. At the same time, the leadership mix was unusually selective: cyclical Energy and Industrials were strong, Technology also participated, and defensive Utilities rose, while defensive Health Care and Staples fell. That pattern is more consistent with cross-sector repositioning than a clean growth-versus-value or cyclical-versus-defensive regime shift.
Market breadth was positive but not especially robust. NYSE advancers outnumbered decliners by 1.234-to-1, while the Nasdaq advance-decline ratio was 1.04-to-1. Total U.S. exchange volume was about 17.25 billion shares, close to the 20-day average of 17.19 billion. The more cautious signal came from new lows: the S&P 500 recorded four new 52-week highs versus 41 new lows, and the Nasdaq posted 41 new highs versus 287 new lows. In other words, participation improved enough to support the indexes, but the underlying trend quality remained fragile.
Institutional Flow Insight: A reasonable institutional interpretation is that Thursday’s rotation paired duration relief with commodity-linked earnings protection. The 10-basis-point decline in the 2-year Treasury yield reduced some discount-rate pressure on technology and services stocks, while the oil spike improved the near-term cash-flow backdrop for Energy. The first session of a new quarter can also produce rebalancing flows, although public market data cannot verify how much quarter-start allocation activity drove Thursday’s tape. With the 10-year yield still above 5%, the setup argues for selective risk-taking rather than an indiscriminate expansion of equity risk budgets.
2. Decoding the Biggest Market Movers
Accenture (ACN)
Accenture closed at $212.30, up 15.78% in regular trading. The catalyst was a combination of better-than-guided fiscal fourth-quarter execution and a fiscal 2027 outlook that supported earnings visibility. For the quarter, Accenture reported revenue of $18.68 billion, up 6% in U.S. dollars and 7% in local currency, above its prior $17.75 billion to $18.40 billion range. New bookings were $22.17 billion, representing a book-to-bill ratio of 1.2. GAAP operating margin was 15.3%, GAAP diluted EPS was $3.29, and free cash flow was $2.85 billion. For fiscal 2027, the company guided first-quarter revenue to $18.95 billion to $19.60 billion, full-year local-currency revenue growth to 3% to 6%, GAAP EPS to $14.39 to $14.81, operating margin to 15.9% to 16.1%, and free cash flow to $11.0 billion to $11.8 billion.
The most investable point is not simply that consulting demand accelerated. Management’s official earnings-call transcript said the overall demand environment, including discretionary spending, had not meaningfully changed. Instead, the strength was tied to execution, large-scale reinvention programs, managed-services demand and AI-related work. Accenture said nearly 100 additional clients initiated first advanced-AI work during the quarter and more than 400 did so during fiscal 2026. That distinction matters for peer valuation: the rally supports the case that service providers with embedded enterprise relationships and demonstrable AI monetization can defend earnings visibility even without a broad rebound in discretionary IT budgets.
Micron Technology (MU)
Micron closed at $1,097.39, up 3.03%. The company had just reported record fiscal fourth-quarter 2026 results, with revenue of $54.23 billion, GAAP gross margin of 86.8%, GAAP operating margin of 80.7% and GAAP diluted EPS of $32.87. On a non-GAAP basis, gross margin was 87.0% and diluted EPS was $33.42. Operating cash flow reached $43.97 billion. For fiscal first-quarter 2027, Micron’s official prepared earnings-call remarks guided revenue to $61.5 billion, plus or minus $1.5 billion, non-GAAP gross margin to approximately 86.25%, and non-GAAP EPS to $38.15, plus or minus $1.00.
Micron’s read-through extends beyond one semiconductor stock. Management said memory and storage industry demand had strengthened since its previous call and that it expected the supply-demand environment to tighten further in fiscal 2027 and 2028. The company also cited 26 Strategic Customer Agreements and approximately $150 billion of remaining performance obligations under qualifying agreements. That contractual visibility reinforces confidence around AI infrastructure spending and memory pricing, which can support semiconductor sentiment more broadly. The counterweight is expectations risk: margins and pricing are already elevated, so future upside increasingly depends on sustained demand, disciplined industry supply and continued execution rather than simple multiple expansion.
3. Macro Indicators and Market Outlook
The Cboe Volatility Index finished at a daily closing level of 16.39, up 0.05 point, or 0.31%. The slight increase in volatility alongside a higher S&P 500 is notable because it suggests hedging demand did not fully recede as equities recovered. That divergence is consistent with investors carrying event protection into the next session’s employment report and with the unusually large intraday swings in Treasury yields. It does not indicate panic conditions, but it does argue against interpreting Thursday’s equity rebound as a full normalization of risk appetite.
The official U.S. Treasury closing curve showed the 2-year yield at 4.78%, down from 4.88% on September 30, and the 10-year yield at 5.24%, down from 5.29%. The 2s10s spread therefore steepened from roughly 41 basis points to 46 basis points. Earlier in the session, longer-dated yields had pushed to multi-decade highs before reversing. Reuters reported that the decline extended after Federal Reserve Vice Chair Philip Jefferson signaled patience before another rate increase following the September policy move. The more important market message is that investors were repricing both near-term policy sensitivity and the growth-inflation balance; a single day’s yield move should not be treated as confirmation of a future Fed path. The September ISM Manufacturing PMI held at 54.5, while its Prices Index climbed 6.8 points to 77.9, preserving inflation pressure even as growth remained resilient.
Oil also had direct explanatory power for the equity rotation. Brent crude settled more than $4 per barrel higher after China suspended fuel exports, according to Reuters, tightening the perceived near-term supply backdrop. That move helped explain Energy’s sector leadership, while also preserving a potential inflation channel that could push back against the bond rally if crude strength persists.
Upcoming Economic Data & Catalysts:
- U.S. Employment Situation for September 2026 (Release date: October 2, 2026): The Bureau of Labor Statistics release will be the next major test for the rates market. Investors will focus on payroll growth, unemployment and wage trends for evidence on labor-market resilience and inflation pressure, with direct implications for front-end Treasury yields and equity duration sensitivity.
- U.S. Consumer Price Index for September 2026 (Release date: October 14, 2026): CPI will be a key input into the market’s inflation assessment after the sharp rise in the ISM Prices Index and the renewed oil move. A material surprise could reprice Treasury yields, equity valuation assumptions and sector leadership.
Only officially scheduled events after the October 1 close are included above.
Market Insights:
The October 1 advance was broader than a pure mega-cap rally because small caps outperformed and advancers modestly exceeded decliners, but it was not a clean broad-risk-on session. Six S&P 500 sectors fell, new 52-week lows remained numerous, and VIX edged higher. The tape therefore looks more like selective stabilization driven by lower yields, Energy strength and company-specific earnings visibility. The clearest reversal risks are a renewed surge in Treasury yields, deterioration in breadth, downward earnings revisions, a volatility breakout, or valuation compression in stocks that have already priced in unusually strong AI-linked demand.
Trading & Investment Strategy:
Position sizing should remain calibrated to the unusually volatile rates backdrop and the near-term macro calendar. Staggered entries can reduce event-timing risk around payrolls and inflation data, while sector selection should emphasize visible cash flows, pricing power and balance-sheet resilience rather than chasing duration exposure alone. Energy strength should be treated as oil-sensitive rather than structurally guaranteed, and post-earnings gaps in names such as Accenture and Micron warrant discipline because strong fundamentals can coexist with elevated short-term expectations. Investors should define risk limits and exit levels before entry, avoid excessive leverage, and reassess exposures if Treasury yields retest recent highs, VIX rises materially, or breadth weakens further.
4. Key FAQs About the US Stock Market Today
Why did the US stock market move on October 1, 2026?
U.S. stocks recovered from early weakness as Treasury yields reversed lower after reaching multi-decade highs, easing discount-rate pressure on equities. Energy benefited from a sharp oil rally, Technology received support from company-specific earnings strength, and resilient macro data kept the growth outlook intact. The offset was persistent inflation sensitivity, highlighted by the ISM Manufacturing Prices Index rising to 77.9, which limited the case for a broad, low-volatility risk rally.
Which sectors performed best and worst in the US stock market on October 1, 2026?
Energy was the best-performing S&P 500 sector, up 1.92%, followed by Industrials at 1.00% and Information Technology at 0.76%. Health Care was the weakest sector, down 1.30%, with Communication Services down 1.19% and Real Estate down 0.62%. The dispersion reflected a combination of higher oil prices, lower Treasury yields and stock-specific earnings catalysts rather than a uniform shift toward either cyclicals or defensives.
What should investors watch after the US stock market close on October 1, 2026?
The immediate catalyst is the September Employment Situation report on October 2. Investors should also watch whether the 2-year and 10-year Treasury yields extend Thursday’s reversal, whether VIX moves decisively away from the mid-teens, and whether market breadth improves beyond modestly positive advance-decline ratios. On the corporate side, the durability of AI-linked earnings visibility in consulting and semiconductors remains important, but valuation discipline matters because strong results have already produced large post-earnings price moves.
Primary sources: Reuters U.S. market-close reporting; U.S. Treasury daily par yield curve; Cboe VIX historical data; U.S. Department of Labor; ISM September 2026 Manufacturing PMI; BLS October 2026 release calendar; Accenture fiscal Q4 2026 earnings release filed with the SEC; Accenture official fiscal Q4 2026 conference-call transcript; and Micron fiscal Q4 2026 earnings release and official fiscal Q4 2026 earnings-call prepared remarks. Micron’s IR page listed prepared remarks rather than an issuer-published full Q&A transcript at the time of verification, so no third-party transcript was used.
Disclaimer: This article is intended solely for the exchange of investment ideas and does not constitute investment advice of any kind.