Key Takeaways
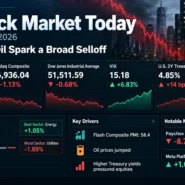
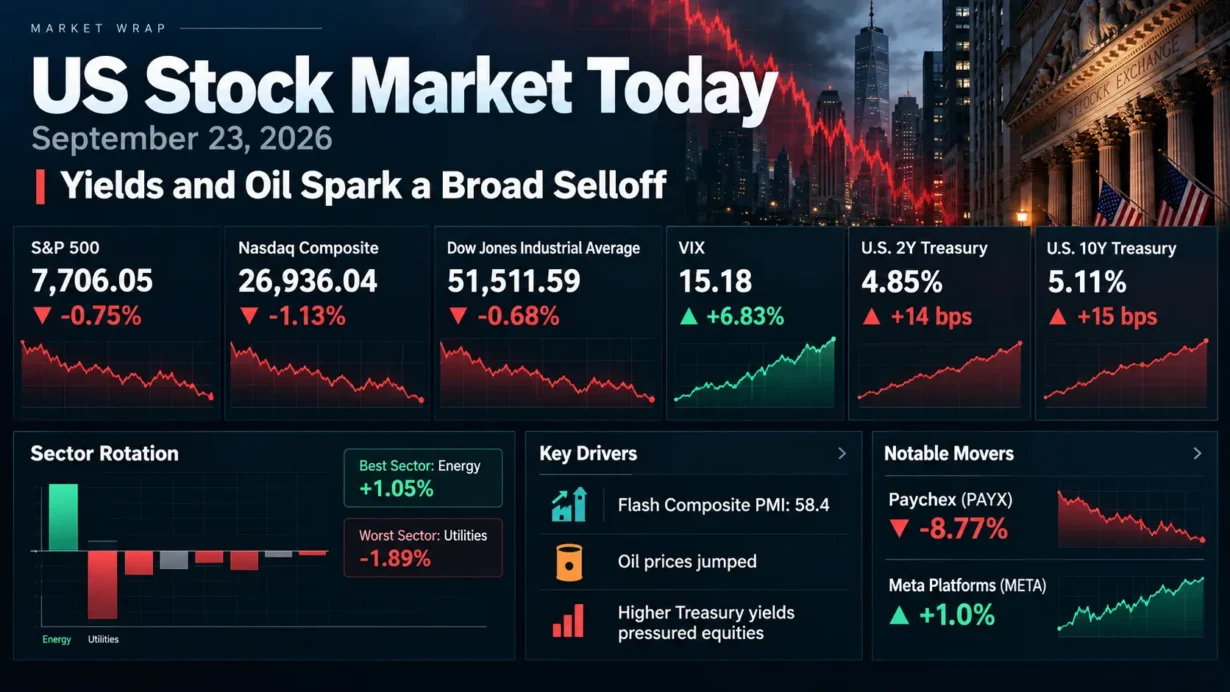
- The S&P 500 fell 0.75% to 7,706.05, the Nasdaq Composite lost 1.13% to 26,936.04, and the Dow declined 0.68% to 51,511.59 as higher oil prices and Treasury yields pressured equities. Source: Reuters.
- Energy was the only clearly differentiated haven within cyclical equities, gaining 1.05%, while rate-sensitive utilities fell 1.89%. Nine of 11 S&P 500 sectors declined. Source: TipRanks sector close; Reuters.
- S&P Global’s September flash composite PMI rose to 58.4 from 56.0 in August, signaling stronger activity alongside faster cost inflation. Official Treasury data showed the two-year yield at 4.85% and the 10-year at 5.11%. Source: S&P Global; U.S. Treasury.
- The VIX rose 0.97 point to 15.18. Paychex plunged 8.77% despite higher reported earnings, while Meta gained 1.0% following new AI-glasses announcements. Source: Cboe; Paychex closing quote; Reuters.
1. Market Capital Flows and Sector Rotation
Wednesday’s decline was a cross-sector repricing of inflation and discount-rate risk, rather than an isolated technology selloff. Energy led the S&P 500 with a 1.05% gain as Brent crude climbed roughly 4% amid renewed Middle East supply concerns. Utilities lost 1.89%, the weakest sector in the cited closing-sector dataset; communication services and consumer discretionary also came under pressure. Bond-like defensive equities offered little protection when the yield available on Treasuries increased, while oil-linked producers benefited from a potentially stronger near-term cash-flow backdrop. Source: TipRanks, September 23 sector close; Reuters.
Small caps were more exposed to tighter financial conditions: the Russell 2000 declined approximately 1.77%, versus the capitalization-weighted S&P 500’s 0.75% loss. Growth-heavy Nasdaq shares underperformed the Dow, but the energy rally shows that value-oriented exposures were not uniformly weak; neither were defensive shares uniformly resilient. Market breadth confirmed the pressure: S&P 500 decliners outnumbered advancers by approximately 1.9 to 1, and 17.0 billion shares changed hands across U.S. exchanges, above the preceding 20-session average of 16.5 billion. These observations argue against characterizing the move as merely a handful of mega-cap declines. Source: Cboe Russell 2000 index values; Reuters market breadth and volume.
Institutional Flow Insight: The price action is consistent with a possible reduction in duration-sensitive equity exposure as both short- and long-term yields reset higher. Energy offers a potential earnings offset to rising crude, whereas utilities, richly valued recurring-revenue businesses and smaller borrowers can face a higher cost of capital. Portfolio managers approaching quarter-end may also reassess concentration and risk budgets. These are interpretations of relative returns, not verified institutional transaction flows; the session’s breadth and price data cannot identify who bought or sold.
2. Decoding the Biggest Market Movers
Paychex (PAYX)
Paychex closed at $104.49, down 8.77%, following its fiscal first-quarter 2027 release. For the quarter ended August 31, 2026, reported revenue increased 6% to $1,630.5 million; GAAP diluted EPS rose 14% to $1.21, and adjusted diluted EPS increased 10% to $1.34. GAAP operating margin expanded to 38.0% from 35.2%, while adjusted margin improved to 42.0% from 40.7%. PEO and Insurance Solutions revenue grew 12% to $367.6 million, but Management Solutions revenue rose a slower 4%. For fiscal 2027, management maintained its 5%–6% total-revenue-growth outlook and 7%–9% adjusted-EPS-growth outlook, while raising its PEO and Insurance Solutions growth range to 7%–8%. Those outlook figures are company guidance, not realized results. Source: Paychex’s September 23 earnings release, filed with the SEC; September 23 closing price.
The earnings-call distinction matters: management said Management Solutions was slightly below its internal expectations partly because customers upgraded from administrative services into higher-revenue PEO arrangements faster than anticipated. It reported that these conversions were twice its expectations; that is a management statement, not independent evidence of future revenue. The selloff therefore should not be read as proof of broad-based client deterioration. A more cautious interpretation is that investors discounted slower growth in the core segment, an unchanged consolidated outlook and a higher equity discount rate despite stronger margins. That read-through matters for payroll and human-capital-management peers whose valuations rely on predictable subscription growth. Source: September 23 Paychex earnings-call transcript, third-party transcription; Official Paychex earnings-call webcast listing.
Meta Platforms (META)
Meta gained 1.0%, contrasting with Alphabet’s 3.8% decline and the weaker communication-services complex. At its September 23 Connect event, Meta announced Ray-Ban Meta Audio glasses starting at $349, an expanded AI-glasses lineup and plans to bring its Muse assistant to wearable devices; it also introduced third-generation Ray-Ban Meta glasses starting at $449. This is a distribution and product-positioning catalyst, not evidence of booked hardware profits. Source: Meta’s September 23 official product announcement; Reuters closing moves.
The commercial question is whether consumer AI engagement can generate incremental advertising, commerce or device economics sufficient to absorb infrastructure spending. Meta’s most recent reported quarter, Q2 2026, delivered $60.801 billion in revenue, up 28%, but GAAP diluted EPS fell to $6.18 from $7.14 and operating margin narrowed to 31% from 43%. Management guided to $61 billion–$64 billion of Q3 revenue and $130 billion–$145 billion of full-year 2026 capital expenditures, including finance-lease principal payments. These are July 29 disclosures and management guidance, not September 23 earnings. Meta’s relative strength suggests selective enthusiasm for an AI consumer platform even as higher yields weighed on other mega-cap growth stocks; its spending intensity remains the offsetting valuation risk. Source: Meta’s official Q2 2026 results; Official Q2 earnings-call materials and transcript.
3. Macro Indicators and Market Outlook
Cboe’s VIX finished at 15.18, up 0.97 point, or 6.83%, from 14.21. Rising implied volatility was directionally consistent with falling equities and greater demand for downside protection, although a reading below 20 does not, by itself, indicate acute market stress or establish the volume of actual hedging. Source: Cboe, September 23 VIX data.
Official U.S. Treasury daily par-yield data put the two-year yield at 4.85%, up 14 basis points from September 22, and the 10-year at 5.11%, up 15 basis points. The 10-year–two-year spread was approximately positive 26 basis points, virtually unchanged from the preceding session’s 25 basis points: the dominant move was an upward repricing across maturities, not a dramatic curve steepening. The stronger flash PMI and its accompanying cost-pressure readings supported a less accommodative policy interpretation, while higher oil prices also raised inflation concerns. The 10-year move could reflect a combination of expected short rates, inflation compensation and term premium; a single day’s yield change cannot isolate those components or establish the next Federal Reserve decision. Source: U.S. Treasury, September 22–23 daily par yields; S&P Global’s September flash PMI.
Upcoming Economic Data & Catalysts:
- U.S. Census Bureau — August New Residential Sales (Release date: September 24, 2026, 10:00 a.m. ET): New-home demand and inventory will test housing’s resilience to higher mortgage rates, with implications for homebuilders and interest-rate-sensitive consumption. Source: Census Bureau release schedule.
- U.S. Census Bureau — August Advance Durable Goods Orders (Release date: September 25, 2026, 8:30 a.m. ET): Headline orders and the composition of capital-goods demand will help investors distinguish a genuine business-investment impulse from volatile transportation orders. Source: Census Bureau economic-indicator calendar.
Market Insights:
The day’s weakness was broad, with energy’s outperformance the exception, rather than a benign rotation confined to two or three large technology names. A sustained rise in Treasury yields, another crude-oil spike, deteriorating breadth, downward earnings revisions or a sharp VIX acceleration could extend the drawdown. Conversely, stabilizing inflation expectations alongside resilient earnings would change the discount-rate narrative. Neither outcome is established by one session.
Trading & Investment Strategy:
Keep position sizes aligned with portfolio volatility limits, review overlapping mega-cap and interest-rate exposures, and consider staged entries instead of chasing isolated rallies. Within cyclicals, assess whether improved commodity realizations are offset by operating-cost inflation; within defensives, distinguish durable cash flows from excessive bond-proxy valuations. Use predefined exit or reassessment levels appropriate to liquidity and investment horizon, and avoid interpreting a single strong company release as insulation against market-wide multiple compression.
4. Key FAQs About the US Stock Market Today
Why did the US stock market move on September 23, 2026?
A stronger-than-expected growth signal from S&P Global’s flash PMI came with renewed input-cost pressure, while rising oil prices and Treasury yields lifted inflation and discount-rate concerns. Selling was widespread, and declines in Alphabet and other major stocks compounded the pressure on capitalization-weighted indexes. Source: S&P Global; Reuters.
Which sectors performed best and worst in the US stock market on September 23, 2026?
Energy led the S&P 500 with a 1.05% gain as crude prices advanced; utilities fell 1.89%, the largest loss in the cited closing-sector dataset, as higher bond yields reduced the appeal of rate-sensitive dividend shares. Source: TipRanks sector close.
What should investors watch after the US stock market close on September 23, 2026?
Focus on September 24 new-home sales and September 25 durable-goods orders, alongside the direction of the two- and 10-year Treasury yields, oil prices, VIX and the ratio of advancing to declining stocks. For company-specific risk, monitor whether Paychex’s PEO growth supports its unchanged consolidated guidance and whether Meta can convert AI-device engagement into returns on substantial capital spending. Source: Census Bureau release calendar; Paychex guidance; Meta outlook.
Disclaimer: This article is intended solely for the exchange of investment ideas and does not constitute investment advice of any kind.