
Key Takeaways
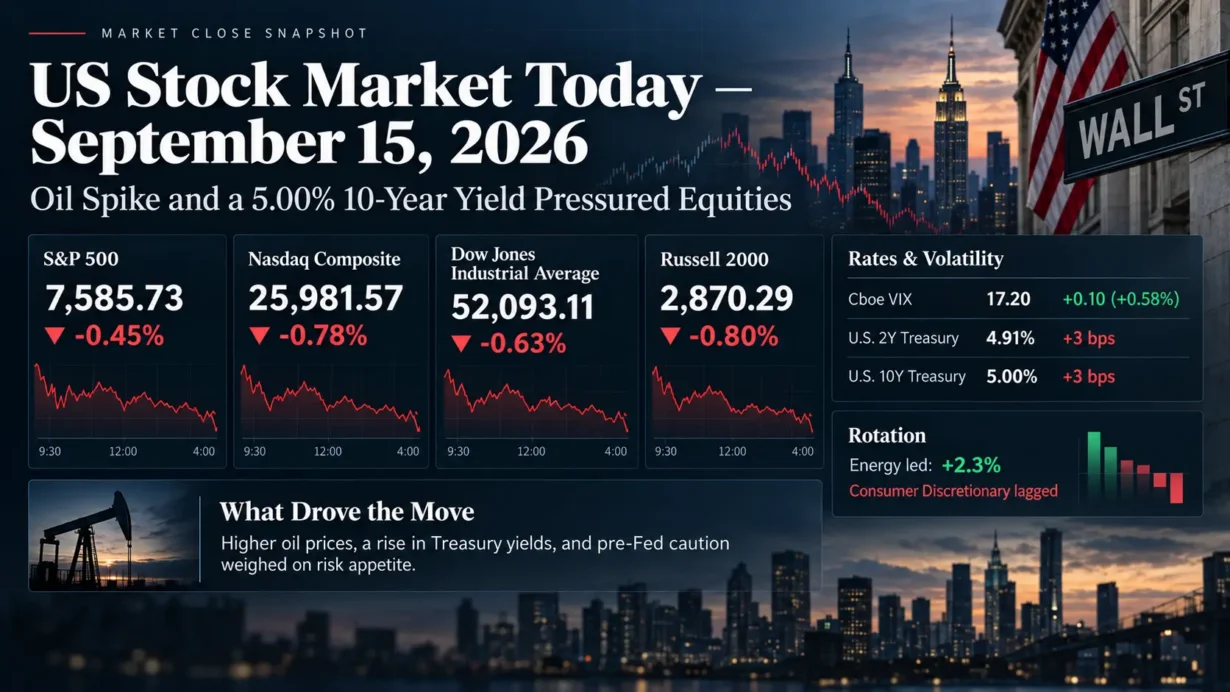
- The S&P 500 fell 0.45% to 7,585.73, the Nasdaq Composite dropped 0.78% to 25,981.57, and the Dow Jones Industrial Average lost 0.63% to 52,093.11. The Russell 2000 also fell about 0.8%, confirming that weakness extended beyond mega-cap stocks.
- Energy was the clear sector outlier, rising 2.3% as crude oil surged, while consumer discretionary was the S&P 500’s worst-performing sector, down 1.8%. Nine of the 11 major S&P 500 sectors finished lower.
- The U.S. Treasury’s official September 15 constant-maturity curve showed the 2-year yield at 4.67%, up 2 basis points, and the 10-year at 5.00%, up 3 basis points. Higher long rates tightened the valuation backdrop for equities ahead of the Federal Reserve decision.
- The Cboe VIX closed at 17.53, up 0.43 points or 2.51%. Breadth was materially weaker than the modest headline index declines implied: NYSE decliners led advancers 2.56-to-1, Nasdaq decliners led 2.33-to-1, and U.S. exchange volume reached 15.85 billion shares versus a 20-day average of 15.14 billion.
- Wednesday’s market setup is unusually catalyst-heavy, with August retail sales due at 8:30 a.m. ET and the Federal Reserve decision at 2:00 p.m. ET, followed by the press conference at 2:30 p.m. ET.
1. Market Capital Flows and Sector Rotation
The September 15 session was not a simple technology selloff. Energy gained 2.3%, the best performance among the S&P 500’s 11 sectors, as the oil shock improved near-term cash-flow expectations for producers. Consumer discretionary fell 1.8%, the worst sector performance, as higher fuel costs and higher yields simultaneously challenged household purchasing power and equity valuations. Small caps also underperformed large caps, with the Russell 2000 down roughly 0.8% versus the S&P 500’s 0.45% decline. Cyclicals were sharply divided: energy rallied on commodity scarcity while consumer discretionary weakened, so the tape did not signal a conventional pro-growth rotation. Defensive exposure was not a reliable shelter either, with utilities among the notable laggards as duration sensitivity became a headwind. Growth underperformed the broad market at the index level, with the Nasdaq down 0.78%, but the session is better characterized as narrow energy leadership than as a broad growth-to-value rotation.
Market breadth reinforces that conclusion. Declining stocks outnumbered advancers by 2.56-to-1 on the NYSE and 2.33-to-1 on the Nasdaq. The S&P 500 Equal Weight proxy, the Invesco S&P 500 Equal Weight ETF, fell 0.49%, close to the cap-weighted index’s 0.45% decline. That gap is too small to describe the session as a mega-cap-only pullback. U.S. exchange volume of 15.85 billion shares also ran above the 20-day full-session average of 15.14 billion, giving the negative breadth more significance than a low-volume drift would have carried.
Institutional Flow Insight: The pattern is consistent with, but does not prove, institutional de-risking ahead of a high-impact policy event. A 5% 10-year yield raises the opportunity cost of owning long-duration equities, while an oil-driven inflation shock improves near-term earnings visibility for energy companies but complicates the margin outlook for fuel-sensitive and consumer-facing businesses. The simultaneous weakness in small caps and poor breadth is also consistent with tighter risk budgets rather than a simple reshuffling among mega-cap leaders. There is little reason to attribute the move to month-end or quarter-end rebalancing because the session occurred mid-month; rates, oil and event risk provide the more direct explanation.
2. Decoding the Biggest Market Movers
Dave & Buster’s Entertainment (PLAY)
Dave & Buster’s closed at $6.86, down 19.01% in regular trading after reporting fiscal second-quarter 2026 results. According to the company’s official Investor Relations release, revenue was $544.1 million, down 2.4% year over year, and comparable-store sales fell 2.9%. The company reported a GAAP net loss of $12.5 million, or $0.36 per diluted share, versus net income of $11.4 million, or $0.32 per diluted share, a year earlier. Adjusted net loss was $9.5 million, or $0.27 per diluted share. Adjusted EBITDA fell to $98.9 million from $129.8 million, with the adjusted EBITDA margin compressing to 18.2% from 23.3%. Store operating income before depreciation and amortization was $127.8 million, equal to 23.5% of revenue versus 27.9% a year earlier. Management said July comparable-store sales improved and that improvement continued into the third quarter to date; the official release did not publish a formal full-year revenue or EPS guidance range. The company ended the quarter with $492.1 million of available liquidity. The selloff therefore reflected more than a single revenue headline: the sharper investment issue was the combination of negative comparable sales and substantial margin compression in a fixed-cost leisure model. That read-through was directionally consistent with the broader weakness in consumer discretionary, although PLAY’s results are company-specific and should not be treated as a sector-wide demand proxy.
Axon Enterprise (AXON)
Axon Enterprise closed at $442.08, down 9.81%. The immediate catalyst was the company’s September 15 announcement of a proposed $1.0 billion public offering of 0% convertible senior notes due 2031, with an underwriter option for up to an additional $150 million. Axon said part of the proceeds would fund capped-call transactions and the remainder would support general corporate purposes, including growth and potential acquisitions or investments. The initial conversion rate and other terms were still to be determined upon pricing, so the market was discounting financing, dilution and capital-allocation uncertainty rather than reacting to a completed transaction with final economics. The capped calls are designed to reduce potential dilution or offset cash payments above principal, subject to a cap, but they do not eliminate execution risk. Importantly, the financing event arrived against a strong operating backdrop: Axon’s official Q2 2026 release reported revenue of $904 million, up 35% year over year, a 60.4% GAAP gross margin, net income of $29 million or $0.36 per diluted share, non-GAAP net income of $155 million or $1.88 per diluted share, and adjusted EBITDA of $242 million with a 26.8% margin. The company had raised full-year 2026 revenue growth guidance to 32% to 34% and maintained an adjusted EBITDA margin outlook of approximately 25.5%. The stock reaction therefore looked more like a financing-structure and valuation reset than an earnings deterioration event. For the broader market, it was a reminder that even high-growth companies with strong reported fundamentals can face a higher equity risk premium when long-term Treasury yields are near 5% and incremental financing introduces dilution uncertainty.
3. Macro Indicators and Market Outlook
The Cboe VIX finished at 17.53, up 0.43 points or 2.51% from the prior close of 17.10. That rise was directionally consistent with the equity decline, but the absolute level remained in the high teens rather than signaling disorderly stress. Combined with poor breadth and above-average volume, the move suggests investors increased hedging and reduced risk without reaching panic conditions. In other words, the equity tape showed broader caution than the VIX level alone would imply.
The U.S. Treasury’s official constant-maturity data showed the 2-year yield at 4.67%, up 2 basis points from September 14, and the 10-year yield at 5.00%, up 3 basis points. The 2s10s curve therefore remained positively sloped at roughly 33 basis points. Reuters reported that the benchmark 10-year yield breached 5% in trading and reached its highest level since 2007. The move reflected a market reassessment of inflation, Federal Reserve policy risk and longer-run term premium as higher energy prices collided with resilient economic activity and heavier borrowing concerns. A one-day increase in yields, however, should not be interpreted as proof of any particular sequence of future rate hikes or cuts.
Oil had clear explanatory power for the equity rotation. Front-month WTI settled 4.4% higher and Brent rose 2.9%, with WTI ending at $105.83 and Brent at $108.75 as supply concerns intensified around Middle East energy infrastructure. The result was a two-sided shock for equities: stronger cash-flow expectations for producers, but higher input costs and inflation sensitivity for consumers, transports and rate-sensitive growth assets.
Upcoming Economic Data & Catalysts:
- Advance Monthly Sales for Retail and Food Services for August 2026 (Release date: September 16, 2026): The U.S. Census Bureau is scheduled to release the report at 8:30 a.m. ET. Investors will focus on the strength and composition of consumer spending because a materially different demand signal can affect front-end Treasury yields, GDP tracking and earnings expectations for consumer-facing industries.
- Federal Open Market Committee policy decision and press conference (Release date: September 16, 2026): The Federal Reserve’s two-day meeting concludes with the policy decision at 2:00 p.m. ET and a press conference at 2:30 p.m. ET. The policy rate, statement language and updated economic projections will be central to the market’s assessment of inflation risk, growth and the expected path of policy.
Market Insights:
The September 15 decline was broad enough that it should not be dismissed as weakness in a handful of mega-cap stocks. Nine S&P 500 sectors fell, equal-weight performance was close to the cap-weighted index, small caps lagged, and both NYSE and Nasdaq breadth were decisively negative. At the same time, the VIX remained below 18, so the session looked more like an orderly repricing of rates, energy and event risk than a liquidity shock. The main reversal risks are a further rise in long-term yields, another leg higher in crude, continued deterioration in market breadth, downward earnings revisions or a volatility breakout that forces systematic risk reduction. Conversely, stabilization in yields and oil combined with improving breadth would reduce the pressure on equity duration and risk budgets.
Trading & Investment Strategy:
Risk management matters more than directional conviction around a binary policy catalyst. Position sizes should reflect the possibility of large post-Fed moves in both rates and equities, and staggered entries can reduce timing risk relative to chasing a single close. Sector selection should distinguish between commodity-driven earnings support and businesses facing margin compression from higher input costs. Investors adding growth exposure should demand stronger balance sheets, visible cash generation and valuation support when the 10-year yield is around 5%. Energy strength can remain fundamentally supported by oil, but chasing a sharp one-day move after a supply shock increases reversal risk. Predefined exit levels, disciplined stop-loss rules where appropriate, and portfolio-level drawdown limits are preferable to increasing leverage into event volatility.
4. Key FAQs About the US Stock Market Today
Why did the US stock market move on September 15, 2026?
U.S. stocks fell because rising Treasury yields and another sharp increase in crude oil tightened financial conditions and raised inflation concerns ahead of the Federal Reserve decision. The 10-year Treasury reached the 5% area, energy prices jumped, and broad market breadth weakened. Company-specific pressure from Dave & Buster’s earnings and Axon’s proposed convertible-note financing added to the risk-off tone, but the decline was broader than those individual names.
Which sectors performed best and worst in the US stock market on September 15, 2026?
Energy performed best, rising 2.3% as crude prices surged. Consumer discretionary was the worst-performing S&P 500 sector, down 1.8%, reflecting pressure from higher fuel costs, higher discount rates and weaker risk appetite. The split shows that the day’s rotation was driven primarily by the oil and rates shock rather than by a clean cyclical-versus-defensive trade.
What should investors watch after the US stock market close on September 15, 2026?
The next major catalysts are August retail sales at 8:30 a.m. ET on September 16 and the Federal Reserve decision at 2:00 p.m. ET, followed by the press conference at 2:30 p.m. ET. Beyond the headlines, investors should watch whether the 10-year Treasury can stabilize around 5%, whether crude extends its advance, whether market breadth improves, and whether the VIX moves materially above its recent high-teens range. Those signals will help determine whether the session was a contained repricing or the start of a broader tightening in financial conditions.
Disclaimer: This article is intended solely for the exchange of investment ideas and does not constitute investment advice of any kind.