Key Takeaways
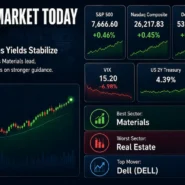
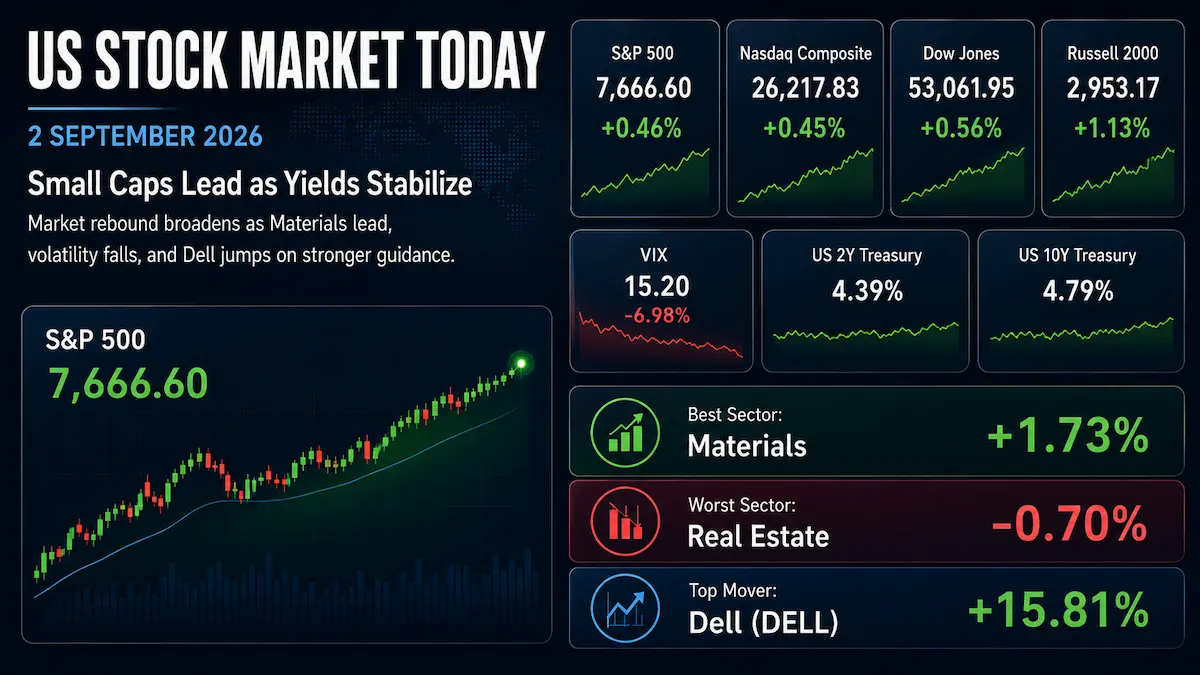
- U.S. equities snapped a three-session losing streak: the S&P 500 rose 0.46% to 7,666.60, the Dow gained 0.56% to 53,061.95, the Nasdaq Composite advanced 0.45% to 26,217.83, and the Russell 2000 outperformed with a 1.13% gain to 2,953.17.
- Leadership broadened beyond mega-cap technology. Materials led the S&P 500 while Real Estate was the only sector to finish lower; small caps, regional banks, airlines and precious-metals miners showed stronger relative momentum.
- Market breadth was constructive but not fully repaired: NYSE advancers beat decliners by 1.78-to-1 and Nasdaq advancers by 1.85-to-1, yet new lows still exceeded new highs on both exchanges and total U.S. volume of 14.75 billion shares remained below the 20-session average of 15.19 billion.
- The Cboe VIX fell 6.98% to 15.20, while the U.S. Treasury’s official daily par yields finished at 4.39% for the 2-year and 4.79% for the 10-year, both unchanged from September 1 at the Treasury’s published precision.
- Dell Technologies surged 15.81% after reporting stronger Q2 FY27 revenue, earnings and margins and raising its full-year revenue, AI-server revenue and EPS outlook, reinforcing investor confidence in AI infrastructure demand.
1. Market Capital Flows and Sector Rotation:
Wednesday’s rebound was broader than a typical mega-cap relief rally. The Russell 2000 gained 1.13%, more than double the S&P 500’s 0.46% advance, indicating a meaningful rotation toward smaller companies after three consecutive down sessions for the broader market. Reuters confirmed Materials as the best-performing S&P 500 sector and Real Estate as the only sector to decline. Using the corresponding Select Sector SPDRs as liquid investable proxies, Materials gained 1.73% while Real Estate fell 0.70%. The tape therefore favored economically sensitive and reflation-linked exposures over rate-sensitive property equities. Large-cap technology still contributed positively, helped by gains in Nvidia, Micron and Qualcomm, but it was not the sole engine of the advance. S&P 500 growth modestly outperformed value on style proxies, while the more important cross-cap signal was the clear small-cap advantage. Cyclical leadership was visible in materials, airlines and regional banks, although the positive advance-decline ratios suggest the rally was not confined to one narrow factor bucket.
Market breadth improved enough to validate the index rebound, but the internal picture still argued against declaring a fully repaired risk-on trend. NYSE advancers outnumbered decliners 1.78-to-1 and the Nasdaq ratio was 1.85-to-1. At the same time, the NYSE recorded 290 new lows versus 150 new highs, while the Nasdaq posted 135 new lows versus 58 new highs. Total U.S. exchange volume was 14.75 billion shares, below the trailing 20-session average of 15.19 billion. In portfolio terms, that combination is consistent with a broad relief bid, but not yet with the kind of high-volume participation and expanding new-high list that would normally strengthen confidence in a durable breakout.
Institutional Flow Insight: The rotation can reasonably be interpreted as a combination of bargain hunting after the three-day decline, reduced demand for near-term index hedges as volatility fell, and selective re-risking into smaller and more cyclical companies once long-duration Treasury yields stopped rising on the day. Month-start rebalancing may also have helped broaden flows, but public market data cannot confirm that as a discrete institutional driver. The continued weakness in Real Estate highlights that rate sensitivity still matters even when yields merely stabilize, while the preference for companies with visible earnings catalysts suggests that investors were not indiscriminately adding beta. For asset allocators, the key distinction is that Wednesday looked more like a widening of the opportunity set than a wholesale increase in risk budgets.
2. Decoding the Biggest Market Movers:
Dell Technologies (DELL)
Dell Technologies closed at $492.20, up 15.81%, after its Q2 FY27 results and updated outlook materially improved earnings visibility. For the quarter ended July 31, 2026, Dell reported revenue of $46.97 billion, up 58% year over year. GAAP diluted EPS was $6.34, up 273%, while non-GAAP diluted EPS reached $7.04, up 203%. Profitability improved alongside growth: GAAP gross margin was 20.9%, versus 18.3% a year earlier, while non-GAAP gross margin was 21.1%, versus 18.7%. Non-GAAP operating income rose 160% to $5.93 billion and the non-GAAP operating margin expanded to 12.6% from 7.7%. Cash flow from operations was $2.23 billion.
The infrastructure business was the central earnings catalyst. Infrastructure Solutions Group revenue rose 89% to $31.8 billion and operating income increased 225% to $4.8 billion. AI-optimized server revenue reached $16.4 billion, Dell recorded $60.9 billion of AI-server orders during the quarter, and ending AI-server backlog stood at $95 billion. Importantly, the strength was not limited to AI systems: traditional servers and networking revenue rose 122% to $10.5 billion, while storage increased 26% to $4.9 billion. Client Solutions Group revenue grew 20% to $15.0 billion, with commercial client revenue up 22% to $13.2 billion.
Management also raised the full-year framework. Dell now expects FY27 revenue of $192.0 billion at the midpoint, up 69% year over year and $25 billion above its prior midpoint. It lifted expected FY27 AI-optimized server revenue to $74 billion, up from the previous $60 billion outlook. Full-year GAAP diluted EPS is projected at $24.37 and non-GAAP diluted EPS at $25.50, representing year-over-year growth of 181% and 148%, respectively. For Q3, Dell guided to a $49.0 billion revenue midpoint, GAAP diluted EPS of $6.10 and non-GAAP diluted EPS of $6.50.
The investment significance extends beyond Dell itself. The combination of record AI orders, a $95 billion backlog, stronger non-AI infrastructure demand and sharply higher operating margins supports the view that the AI capital-spending cycle is generating operating leverage for selected hardware vendors rather than only top-line growth. That can support valuation multiples across AI infrastructure when backlog converts into revenue without margin erosion. It also helped offset softer software and services performance in the broader technology complex. The counterweight is execution risk: exceptionally fast growth raises the importance of supply availability, customer concentration, product mix and the ability to preserve margins as large AI systems scale. Wednesday’s price gap therefore reflected a major upward reset in earnings expectations, but it should not be interpreted as eliminating those risks.
3. Macro Indicators and Market Outlook
The Cboe VIX closed at 15.20, down 1.14 points, or 6.98%, from 16.34 on September 1. That decline was directionally consistent with the equity rebound and suggests less immediate demand for broad index protection after the prior three-day selloff. However, the fall in volatility occurred against a backdrop of geopolitical tension, oil prices above $90 per barrel and still-elevated long-term bond yields. In other words, option markets priced less near-term stress on Wednesday, but they did not remove the macro event risk that had contributed to the earlier equity weakness.
On the U.S. Treasury’s official daily par-yield curve, the 2-year yield finished at 4.39% and the 10-year at 4.79%, both unchanged from September 1 at two-decimal precision, leaving the 2s10s curve positively sloped by about 40 basis points. Intraday trading was more volatile: Reuters marked the 10-year near 4.794% late in the session after it had touched 4.818%, its highest level since November 2023. The important signal for equities was therefore stabilization rather than a fresh dovish repricing. The front end remained consistent with restrictive policy, while the elevated long end continued to reflect the market’s need to price inflation, growth, fiscal supply and term-premium risks. A single day’s yield movement does not establish a definitive Federal Reserve rate path.
Labor data added another layer to the policy debate. ADP reported a 38,000 increase in private payrolls for August, down from a revised 46,000 increase in July, reinforcing signs of slower hiring. At the same time, energy remained an inflation-sensitive risk factor as West Texas Intermediate crude settled at $91.01 per barrel, up 0.9%, and Brent settled at $95.63, up 1.0%, amid renewed U.S.-Iran tensions. That combination leaves the market balancing softer labor momentum against an energy-driven inflation risk, a mix that can keep both equity multiples and the long end of the Treasury curve sensitive to incoming data.
Upcoming Economic Data & Catalysts:
- Employment Situation for August 2026 (Release date: September 4, 2026): The Bureau of Labor Statistics report will provide the next official read on nonfarm payrolls, unemployment and average hourly earnings. A material surprise could alter expectations for growth, wage pressure and the policy path, with direct implications for front-end yields and rate-sensitive equity valuations.
- Consumer Price Index for August 2026 (Release date: September 11, 2026): Investors will focus on headline and core inflation, particularly whether higher energy costs are beginning to broaden into underlying price pressure. The result will matter for Treasury yields, equity discount rates and the market’s willingness to pay premium multiples for long-duration growth assets.
Market Insights:
Wednesday’s move was better characterized as a broad rebound with mega-cap reinforcement than as a rally driven by only a few index heavyweights. The Russell 2000’s 1.13% gain, positive advance-decline ratios and Materials leadership all point to wider participation, while gains in Nvidia and other semiconductor names added large-cap support. The less constructive evidence is that new lows still exceeded new highs and volume remained below its 20-session average. The rebound would become more vulnerable if the 10-year yield makes a renewed breakout above Wednesday’s 4.818% intraday high, market breadth deteriorates, earnings revisions turn lower, oil-driven inflation risk intensifies, policy surprises emerge or the VIX reverses sharply higher from 15.20.
Trading & Investment Strategy:
Risk management should take priority over chasing a one-day relief rally. Investors can preserve core exposure while using staggered entries rather than committing full position sizes after large gaps. Within cyclicals and technology, preference should remain with companies showing improving earnings visibility, free-cash-flow capacity and balance-sheet resilience rather than simply the highest short-term beta. Single-name positions that gap sharply higher, such as Dell, warrant tighter position-size discipline because realized volatility can remain elevated even after a fundamental upgrade. Define downside risk before entry, avoid averaging into a thesis that has been invalidated by deteriorating fundamentals, and retain liquidity around the September 4 employment report and September 11 CPI release.
4. Key FAQs About the US Stock Market Today
Why did the US stock market move on 2 September 2026?
U.S. stocks rose as the prior three-session selloff attracted buyers, Treasury yields stabilized rather than extending their recent rise, and the VIX fell to 15.20. Participation broadened into small caps and cyclical industries, while large technology names also contributed. Softer private-payroll growth supported the view that hiring is cooling, but oil prices above $90 and elevated long-term yields kept inflation and policy risks in focus. Dell’s strong results and higher FY27 outlook added a company-specific boost to AI infrastructure sentiment.
Which sectors performed best and worst in the US stock market on 2 September 2026?
Materials was the best-performing S&P 500 sector and Real Estate was the only sector to finish lower. Using Select Sector SPDRs as investable proxies, Materials rose 1.73% and Real Estate declined 0.70%. The rotation favored cyclical and commodity-linked exposure while rate-sensitive property equities lagged, consistent with a market that became more willing to add risk but remained cautious about long-duration cash flows exposed to elevated bond yields.
What should investors watch after the US stock market close on 2 September 2026?
The next major macro catalyst is the August Employment Situation on September 4, followed by August CPI on September 11. Investors should also monitor whether the 10-year Treasury yield can remain below Wednesday’s 4.818% intraday peak, whether positive advance-decline breadth begins to produce more new highs, and whether the VIX continues to fall without a renewed geopolitical or oil-price shock. At the company level, follow-through in AI infrastructure earnings estimates will be important after Dell’s guidance reset.
Disclaimer: This article is intended solely for the exchange of investment ideas and does not constitute investment advice of any kind.