
⚡ Key Takeaways
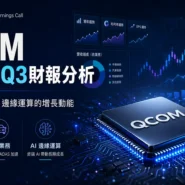
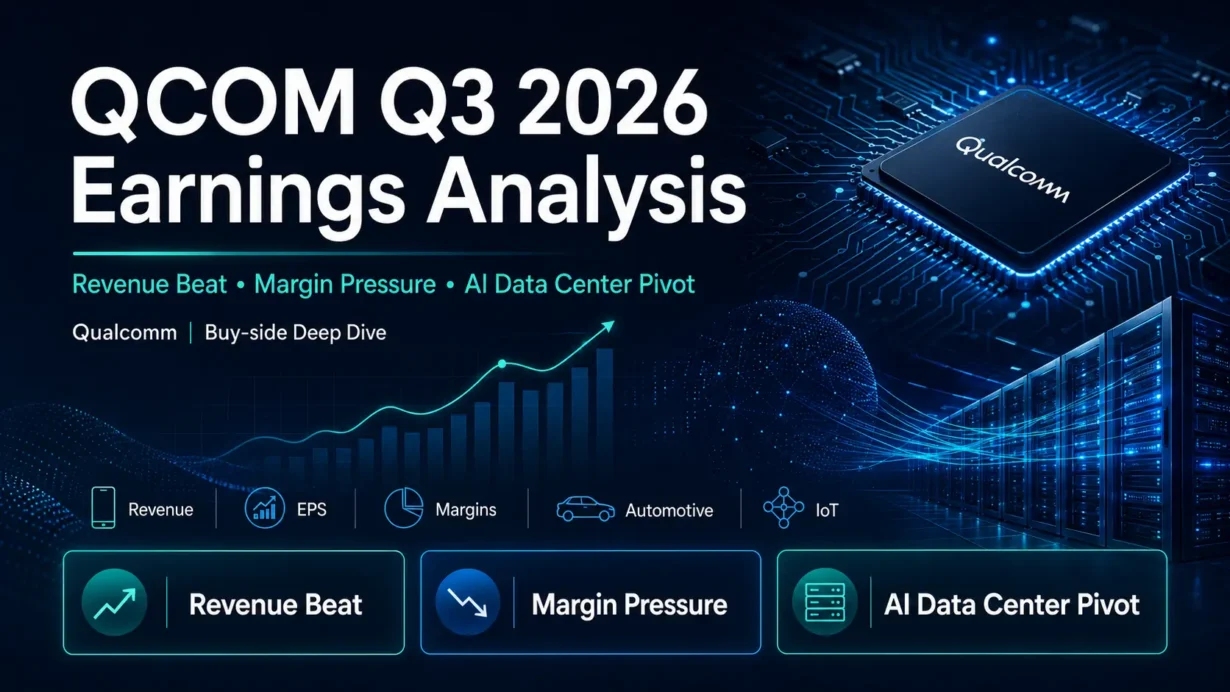
- Top-line beat, bottom-line miss: Qualcomm reported $9.947 billion of revenue, 2.9% above LSEG consensus, while non-GAAP EPS of $2.21 missed the $2.23 estimate by $0.02.
- The earnings mix is changing fast: QCT handset revenue fell 20% year over year, but Automotive surged 61% and IoT grew 9%; combined Automotive and IoT revenue increased 28%.
- The market is de-rating the margin bridge: Q4 EPS guidance was materially below consensus, Apple modem revenue is stepping down faster, and early data center custom silicon revenue will dilute QCT gross margin by an estimated 1.5 to 2 percentage points.
Qualcomm’s fiscal third quarter ended June 28, 2026. The clean read-through is a classic revenue beat but earnings-quality miss: diversification is working at the top line, yet handset mix, input-cost inflation and investment ahead of the data center ramp are compressing margins. For investors, the debate has shifted from whether Qualcomm can grow beyond smartphones to whether the new revenue pool can arrive quickly enough—and at a sufficiently attractive margin—to offset Apple and handset pressure.
Part 1: Core Earnings Breakdown
1. Revenue and Profitability Analysis
- Total revenue: $9.947 billion, down 4% year over year from $10.365 billion.
- GAAP net income: $2.002 billion, down 25%; GAAP diluted EPS was $1.87, down 23%.
- Non-GAAP net income: $2.356 billion, down 23%; non-GAAP diluted EPS was $2.21, down 20%.
- Consolidated non-GAAP operating margin: approximately 27.9%, calculated from $2.776 billion of non-GAAP operating income divided by revenue, versus approximately 34.5% a year earlier—a contraction of about 6.6 percentage points.
Business mix:
- QCT: $8.504 billion, down 5%, representing approximately 85.5% of group revenue. QCT EBT margin fell to 26% from 30%.
- QTL: $1.278 billion, down 3%, representing approximately 12.8% of group revenue. QTL EBT margin remained highly cash-generative at 69%, versus 71% a year earlier.
- Nonreportable segments: $165 million, up from $54 million. These segments include Data Center and QGOV; Qualcomm said the increase was primarily driven by higher Data Center revenue following the Alphawave acquisition.
QCT revenue streams:
- Handsets: $5.086 billion, down 20%; 59.8% of QCT revenue.
- Automotive: a record $1.588 billion, up 61%; 23 consecutive quarters of double-digit year-over-year growth.
- IoT: $1.830 billion, up 9%, led by industrial, networking and robotics products.
Buy-side take: The headline revenue decline understates the strategic progress in Automotive and IoT, but the sharp margin compression shows that Qualcomm is currently paying for diversification before the new businesses reach full scale. This is not yet a clean earnings inflection.
2. Expectations vs. Actual Results
Metric | Q3 FY2026 Actual | Expectation / Benchmark | Result |
|---|---|---|---|
Total revenue | $9.947B | $9.67B LSEG consensus | ✅ Beat by $277M, or 2.9% |
Non-GAAP diluted EPS | $2.21 | $2.23 LSEG consensus | ❌ Miss by $0.02, or 0.9% |
QCT EBT margin | 26% | 25%–27% company guidance; 26% midpoint | ➖ In line |
QCT handset revenue | $5.086B | $4.96B Visible Alpha consensus | ✅ Beat by about 2.5% |
Qualcomm does not provide consolidated operating-margin guidance. QCT EBT margin is therefore the most directly comparable management profitability benchmark for the core chip business.
Q4 FY2026 guidance:
Metric | Company Guidance | Market Benchmark | Read-through |
|---|---|---|---|
Total revenue | $9.7B–$10.5B; $10.1B midpoint | $10.02B LSEG consensus | ✅ Revenue midpoint broadly in line |
Non-GAAP diluted EPS | $2.05–$2.25; $2.15 midpoint | $2.36 LSEG consensus | ❌ Midpoint about 8.9% below consensus |
GAAP diluted EPS | $1.22–$1.42 | Not cited | Acquisition and stock-compensation adjustments remain material |
QCT revenue | $8.4B–$9.0B | $8.49B analyst estimate | Midpoint is above consensus |
QCT EBT margin | 23%–25% | 26% in Q3 | ❌ Sequential margin compression |
QTL revenue / EBT margin | $1.2B–$1.4B / 68%–72% | Normal seasonal pattern | Licensing remains the profit anchor |
Management also expects Q4 handset revenue of approximately $5.2 billion, QCT Automotive growth of about 60% year over year, IoT revenue roughly flat year over year, and non-GAAP operating expenses of approximately $2.7 billion.
3. Earnings Call Highlights
- “We’ve already started wafers.” 💡 Reading Between the Lines: The two hyperscaler custom-silicon wins have moved beyond design discussion: Qualcomm has purchase orders and production activity ahead of December-quarter revenue. This lowers programme-cancellation risk, but the market will still demand proof of yield, shipment scale and repeat generations.
- “Replace total Apple product revenues in ’26.” 💡 Reading Between the Lines: Management is explicitly framing fiscal 2027 as an earnings bridge from Apple modem exposure to Data Center, Automotive and IoT. The strategic logic is credible, but the burden of proof is high because Apple revenue is stepping down before the new mix reaches mature margins.
- “Inventory is … a strategic advantage.” 💡 Reading Between the Lines: Qualcomm is using balance-sheet capacity and scale to secure supply in a fully utilised semiconductor chain. That can protect customer delivery and market share, but it also increases working-capital intensity and inventory-risk exposure if demand or product mix weakens.
Part 2: Deep Business Insights
1. Hidden Key Metrics the Headlines Missed
Hidden metric #1: Data Center is already visible in the accounts—but so is the investment drag.
- Nonreportable segment revenue increased to $165 million from $54 million, with the increase primarily linked to Data Center revenue after Alphawave.
- Nonreportable segment EBT was a $214 million loss, versus a $10 million loss a year earlier.
- Management expects early custom-silicon revenue to run below QCT’s baseline gross-margin range, creating a 1.5 to 2 percentage-point drag on weighted QCT gross margin.
The critical issue is therefore not whether Data Center can generate revenue; it already does. The key issue is the shape of the margin curve. A $5 billion fiscal 2027 revenue target can support the valuation only if the business progresses from lower-margin custom silicon toward higher-value accelerators, CPUs, connectivity and software.
Hidden metric #2: Inventory rose much faster than sales.
- Inventory reached $8.379 billion, up 28.4% from $6.526 billion at fiscal year-end 2025.
- Cash and cash equivalents declined to $4.533 billion from $5.520 billion.
- Revenue, meanwhile, fell 4% year over year.
This is not automatically a red flag: in a supply-constrained market, inventory can secure customer deliveries and improve negotiating leverage. However, it raises the stakes around forecast accuracy, product transitions and demand elasticity after Qualcomm’s double-digit price increases.
Why customers choose Qualcomm:
- Power-efficient compute plus connectivity: Qualcomm combines low-power CPU design, wireless connectivity, AI acceleration and system software—an attractive architecture for edge AI, vehicles, PCs and distributed inference.
- Platform wins instead of single sockets: In Automotive, customers are moving from component-by-component awards to multi-generation platform engagements covering digital cockpit and ADAS. That increases content per vehicle and switching costs.
- Open, heterogeneous software: The Modular acquisition gives Qualcomm a hardware-agnostic software layer designed to simplify deployment across multiple compute platforms, addressing a key barrier to AI infrastructure adoption.
- Supply-chain scale: Large volume across multiple process nodes improves access to constrained wafer, assembly and test capacity—an advantage smaller rivals may struggle to match.
2. Semiconductor Supply-Chain Read-through
- ✅ Potential beneficiary — Taiwan Semiconductor Manufacturing (NYSE: TSM): Qualcomm has begun wafer production for two hyperscaler programmes and described leading-node utilisation as effectively full. The read-through is supportive for foundry utilisation and pricing, although Qualcomm’s new data center ramp remains small relative to TSM’s total revenue base.
- ❌ Potential pressure — Xiaomi (HKEX: 1810; OTC: XIACF) and other premium Android OEMs: Smartphone vendors face a double squeeze from higher memory bills and Qualcomm’s double-digit chipset price increases. They must either absorb lower hardware margins, raise device prices or shift consumers toward older and lower-tier premium models—each outcome can reduce Qualcomm’s premium-chip mix as well.
3. Valuation Framework and Principal Risks
At approximately $148.65 per share at 12:40 p.m. ET on July 31, 2026, QCOM had a market capitalisation of about $159.0 billion and traded at roughly 17.0 times trailing earnings. Reuters reported a next-12-month P/E of approximately 14.31 times and a mean analyst price target of $203.37 after at least nine post-earnings target cuts.
What the current price appears to discount:
- A faster-than-expected Apple modem revenue runoff, including an expected roughly 50% sequential decline from the September to December quarter.
- Near-term QCT margin pressure from input costs, weaker premium-handset mix and the lower initial margin profile of custom data center silicon.
- Scepticism that Qualcomm can scale Data Center revenue from an early base to $5 billion in fiscal 2027 and more than $15 billion in fiscal 2029 without materially increasing execution risk and operating expenses.
Valuation interpretation: QCOM is not priced like a proven AI infrastructure compounder; it is priced as a handset and licensing franchise with a discounted option on Data Center, Automotive and edge AI. That discount can close only when wafer starts convert into recognised revenue, hyperscaler concentration broadens, HBC silicon benchmarks validate the technology and the margin bridge becomes visible. Until then, the low multiple is partly compensation for execution risk rather than an obvious valuation anomaly.
Principal risks:
- Gross-margin risk: Pricing actions take several quarters to flow through contracts, while cost inflation is immediate.
- Demand elasticity: Double-digit chipset price increases can push consumers toward older devices or lower premium tiers.
- Apple concentration unwind: Apple revenue is declining before new businesses have fully matured.
- Data Center customer concentration: Two hyperscaler wins provide visibility but create programme and customer-concentration risk.
- Execution and silicon validation: HBC and server CPU opportunities require successful silicon demonstrations, customer qualification, production yield and software adoption.
- Working-capital risk: Elevated inventory is advantageous during shortages but can become a liability if demand forecasts prove too optimistic.
Part 3: Key FAQs
Did QCOM beat Q3 2026 earnings expectations?
QCOM delivered a mixed result. Revenue of $9.947 billion beat the $9.67 billion LSEG consensus by about 2.9%, but non-GAAP EPS of $2.21 missed the $2.23 estimate by $0.02. QCT EBT margin of 26% landed exactly at the midpoint of company guidance.
Why did QCOM stock fall after Q3 FY2026 earnings?
The market focused on the weaker earnings bridge rather than the revenue beat. Q4 non-GAAP EPS guidance midpoint of $2.15 was about 8.9% below the $2.36 consensus, Apple modem revenue is expected to decline faster, and early Data Center custom-silicon revenue will dilute QCT gross margin.
What is the most important catalyst after QCOM Q3 2026 earnings?
The most important catalyst is the December-quarter start of revenue from two hyperscaler custom-silicon programmes. Investors should monitor recognised Data Center revenue, additional customer wins, HBC silicon performance, QCT gross-margin progression and whether non-handset growth can genuinely replace fiscal 2026 Apple revenue during fiscal 2027.
Primary sources: Qualcomm Investor Relations — Q3 FY2026 Earnings Conference Call, including the official earnings release, presentation, official transcript and Form 10-Q. Consensus comparisons were cross-checked against Reuters and LSEG data.
Disclaimer: This article/chart is for educational and informational purposes only and does not constitute investment advice of any kind. Past performance is not indicative of future results. Investors should independently evaluate their own risks.