

⚡ Key Takeaways
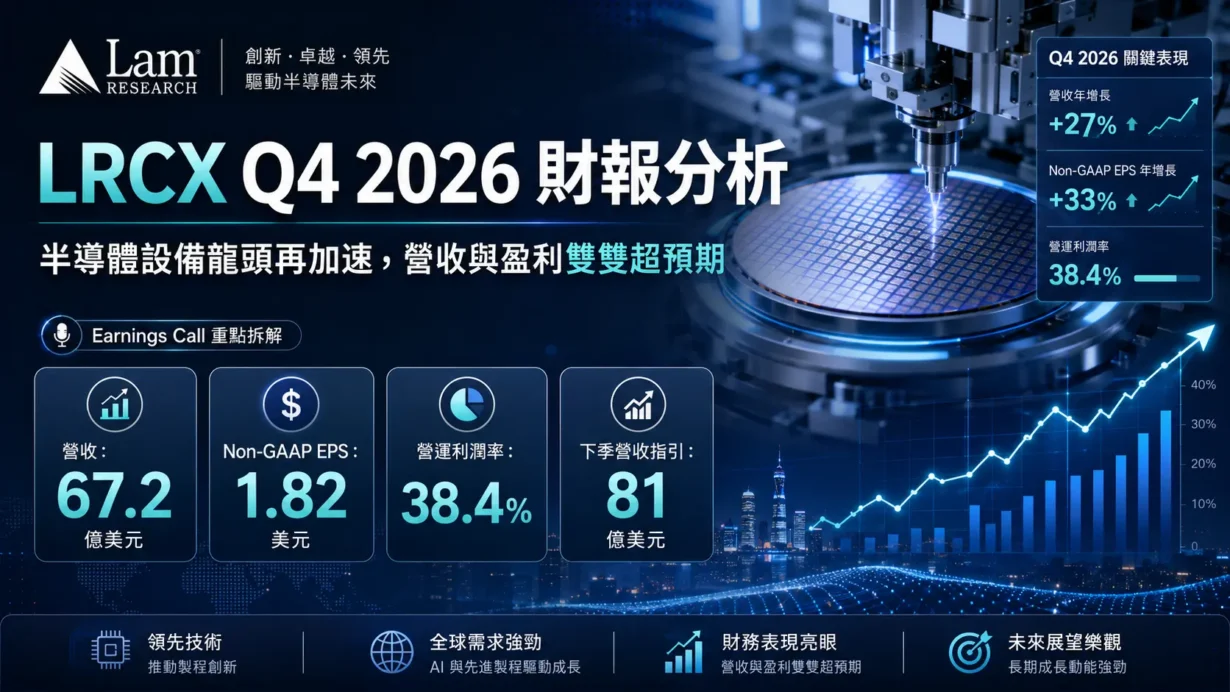
- Lam Research delivered a genuine earnings reset: Q4 FY2026 revenue rose 30.0% year over year to $6.72 billion, while non-GAAP EPS reached $1.82 and non-GAAP operating margin expanded to a record 38.4%.
- The September-quarter guide was more important than the beat: management guided to $8.10 billion of revenue and $2.15 of non-GAAP EPS at the midpoint, materially above published Wall Street expectations.
- The investment debate has shifted from cyclical recovery to execution: NAND revenue more than doubled sequentially, customer-support revenue grew 42.6% year over year, and Lam is targeting structural share gains across high-aspect-ratio etch, gate-all-around, DRAM scaling and advanced packaging.
Part 1: Core Earnings Breakdown
1. Revenue and Profitability Analysis
Lam Research closed fiscal 2026 with its fourth consecutive quarter of record revenue. Q4 FY2026 revenue was $6.722 billion, up 15.1% sequentially and 30.0% year over year. Non-GAAP gross margin reached 52.0%, the highest quarterly level in roughly two decades, while non-GAAP operating margin expanded by 340 basis points sequentially to 38.4%. Non-GAAP diluted EPS increased to $1.82 from $1.47 in the prior quarter.
- Systems revenue: $4.250 billion, representing 63.2% of total revenue; up 13.9% quarter over quarter and 23.6% year over year.
- Customer support-related revenue and other: $2.472 billion, representing 36.8% of total revenue; up 17.1% quarter over quarter and 42.6% year over year.
- Systems mix: Foundry was 44%, non-volatile memory was 23%, DRAM was 23%, and logic/other was 10%.
- Geographic mix: Taiwan contributed 27%, China 26%, Korea 20%, Japan 9%, the United States 9%, Southeast Asia 5%, and Europe 4%.
Buy-side view: This was not a low-quality revenue beat driven by one-off equipment acceptance. Systems accelerated, the installed-base business grew even faster, and operating leverage converted the top-line upside into a much larger earnings beat.
2. Expectations vs. Actual Results
Revenue and EPS comparisons below use published Wall Street consensus. A dependable public consensus for operating margin was not available, so the operating-margin benchmark uses Lam’s prior-quarter company guidance midpoint. Keeping those bases separate avoids a misleading apples-to-oranges comparison.
Metric | Q4 FY2026 Actual | Expectation / Benchmark | Variance | Result |
|---|---|---|---|---|
Revenue | $6.722B | $6.66B Wall Street consensus | +$62M / +0.9% | ✅ Beat |
Non-GAAP diluted EPS | $1.82 | $1.69 Wall Street consensus | +$0.13 / +7.7% | ✅ Beat |
Non-GAAP operating margin | 38.4% | 36.5% company guide midpoint | +190 bps vs. midpoint; +90 bps vs. top end | ✅ Beat |
Q1 FY2027 Guidance: Quarter Ending September 27, 2026
Metric | Lam Guidance | Published Street Benchmark | Read-Through |
|---|---|---|---|
Revenue | $8.10B ± $400M | Approximately $7.11B | ✅ Midpoint about 13.9% above Street and 20.5% above Q4 actual revenue. |
Non-GAAP diluted EPS | $2.15 ± $0.15 | Approximately $1.84 | ✅ Midpoint about 16.8% above Street. |
Non-GAAP gross margin | 52.0% ± 1% | No dependable public consensus used | Management expects the 20-year-high margin level to hold despite a major revenue step-up. |
Non-GAAP operating margin | 39.5% ± 1% | No dependable public consensus used | Another 110-basis-point sequential expansion at the midpoint. |
The guide is the main reason the quarter deserves a valuation reset. A modest Q4 revenue beat alone would not justify a sharp rerating; a September revenue midpoint nearly $1 billion above prior Street expectations does.
3. Earnings Call Highlights
“NAND revenue more than doubled sequentially.”
💡 Reading Between the Lines: The NAND recovery is moving from inventory digestion into technology-transition spending. Lam has unusually high process intensity in high-layer-count NAND, so rising layer counts can increase Lam’s addressable equipment opportunity even without an equivalent increase in wafer capacity.
“Third consecutive year of WFE outperformance.”
💡 Reading Between the Lines: Management is arguing that Lam is no longer merely a proxy for wafer-fabrication-equipment spending. The valuation model increasingly depends on share gains and higher process intensity, with Lam’s serviceable available market moving toward the high-30% range of total WFE.
“Gross margins to mid-50s; operating margins to mid-40s.”
💡 Reading Between the Lines: This long-term framework implies that mix, pricing, installed-base monetisation and operating leverage can keep lifting earnings faster than revenue. It also raises the execution bar: at the current valuation, investors will punish any evidence that the Q4 margin surge was only cyclical.
Part 2: Deep Business Insights
1. Hidden KPIs and Competitive Moat
Hidden KPI No. 1: A $2.92 billion revenue-visibility pool. Deferred revenue rose to $2.43 billion, while estimated future revenue from Japan shipments awaiting customer acceptance reached $490 million. Combined, these items were approximately $2.92 billion, equal to 43.4% of Q4 revenue and up about 10.0% sequentially. This is not formal backlog, and the timing remains subject to acceptance, but it provides unusually strong near-term shipment visibility.
Hidden KPI No. 2: Customer support is becoming an earnings stabiliser. Customer support-related revenue reached $2.47 billion, or 36.8% of group sales, and grew 42.6% year over year. Management said record upgrade revenue was the primary driver. The strategic significance is larger than the headline growth rate: upgrades, spares, services, Reliant tools and Equipment Intelligence monetise an installed base of more than 40,000 conductor-etch chambers, creating recurring touchpoints that can reduce earnings volatility across equipment cycles.
Why customers choose Lam:
- Process co-optimisation: Lam combines etch and deposition rather than selling isolated tools. Management highlighted a co-optimised VECTOR solution that can deliver more than 20% cost savings versus traditional approaches and diffusion-barrier technology that can reduce capacitance by about 5%.
- High-aspect-ratio leadership: NAND layer growth makes deep, narrow structures harder to manufacture. Lam’s Akara platform is gaining share in this technically demanding step, with its installed-base growth trajectory expected to keep doubling in calendar 2027.
- Technology reuse across markets: Argos surface engineering is winning at 2nm and below in foundry-logic and expanding into DRAM. The same core capabilities can therefore compound across gate-all-around, DRAM pitch scaling and advanced packaging.
- Service-layer lock-in: Dextro cobots and Equipment Intelligence automate maintenance and improve tool availability. Preventive-maintenance tasks addressable by Dextro doubled during the first half of calendar 2026, and the rollout remains at an early stage.
2. Semiconductor Supply-Chain Read-Through
- ✅ Ultra Clean Holdings (NASDAQ: UCTT) — upstream beneficiary: Lam Research represented 37.0% of UCTT’s fiscal 2025 revenue. Lam’s more-than-20% sequential revenue guide should support demand for gas-delivery systems, subsystems and outsourced manufacturing. The same concentration creates downside convexity if Lam’s shipment schedule slips, making UCTT a higher-beta derivative of the Lam cycle rather than a diversified read-through.
- ✅ Micron Technology (NASDAQ: MU) — downstream demand validation: Lam’s doubled NAND revenue and sustained DRAM investment support the thesis that memory manufacturers are moving into technology transitions and selective capacity additions. Micron has separately indicated that DRAM and NAND supply-demand conditions could remain tight beyond calendar 2027. That is constructive for pricing and utilisation, although higher equipment spending can weigh on near-term free cash flow.
The broader chain reaction is straightforward: stronger memory and advanced-packaging capex benefits critical subsystem suppliers first, while chipmakers gain only if incremental bit supply remains disciplined. A large equipment order is bullish for Lam immediately but is not automatically bullish for memory pricing two years later.
3. Valuation Framework and Key Risks
Using Lam’s $297.72 closing price on July 30, 2026—the latest completed trading-session close available when this analysis was prepared—the stock traded at approximately 51.2 times fiscal 2026 non-GAAP EPS of $5.82.
A simple annualisation of the September-quarter EPS midpoint produces $8.60 per share, implying a 34.6-times run-rate multiple at the July 30 close. This is not a consensus forward P/E and should not be treated as one; it is merely a stress test showing how quickly the multiple compresses if the earnings step-up proves sustainable.
What the market is pricing in:
- Calendar 2026 WFE spending holds around the low-$150 billion range rather than rolling over after the current investment wave.
- Lam continues to outperform WFE through share gains and higher etch-and-deposition intensity.
- NAND layer-count growth, advanced DRAM, gate-all-around and advanced packaging remain multiyear rather than one-quarter drivers.
- Customer support compounds faster than the installed base through upgrades, services and Equipment Intelligence.
- Operating margin progresses toward management’s mid-40% long-term framework.
Key risks:
- China and export controls: China still represented 26% of quarterly revenue. Further restrictions, licensing delays or a sharper decline in mature-node spending could create both revenue and mix pressure.
- Execution risk on the September ramp: Moving from $6.72 billion to an $8.10 billion midpoint in one quarter requires supply-chain, installation and customer-acceptance execution with little room for slippage.
- Working-capital signals: Days sales outstanding increased to 72 days from 64, accounts receivable rose to $5.34 billion, and inventory reached $4.28 billion. Inventory turns improved, but the absolute build warrants monitoring during a rapid ramp.
- Memory-cycle risk: NAND investment is powerful for Lam today, but aggressive industry capacity additions can eventually weaken memory pricing and trigger another capex correction.
- Tax and earnings conversion: Management expects the next-quarter tax rate to move into the mid-teens from roughly 11% in Q4, partially offsetting operating leverage below the line.
- Valuation compression: A greater-than-50-times trailing earnings multiple leaves limited tolerance for a guide-down, delayed fab project or failure to achieve structural margin expansion.
Buy-side conclusion: LRCX Q4 2026 earnings were stronger than the headline beat suggests because the quality of growth improved at the same time as the forward revenue base stepped up. The quarter supports higher earnings estimates and a structurally higher through-cycle margin assumption. However, after the rerating, the stock is no longer priced as a conventional cyclical equipment name. The next leg of upside requires proof that Lam can convert AI-driven process complexity into sustained WFE outperformance, not simply participate in a strong spending year.
Part 3: Key FAQs
Did LRCX beat Q4 2026 earnings estimates?
Yes. Lam Research reported Q4 FY2026 revenue of $6.722 billion versus approximately $6.66 billion expected and non-GAAP EPS of $1.82 versus approximately $1.69 expected. Non-GAAP operating margin of 38.4% was 190 basis points above the company’s prior guidance midpoint.
What is Lam Research’s Q1 FY2027 guidance after Q4 2026 earnings?
For the quarter ending September 27, 2026, Lam guided to revenue of $8.10 billion ± $400 million, non-GAAP gross margin of 52.0% ± 1%, non-GAAP operating margin of 39.5% ± 1%, and non-GAAP diluted EPS of $2.15 ± $0.15.
Is LRCX stock expensive after the Q4 2026 earnings report?
At the July 30 close of $297.72, LRCX traded at approximately 51.2 times fiscal 2026 non-GAAP EPS. That is a premium valuation for a semiconductor-equipment company, but the multiple falls to about 34.6 times on a simple annualised September-quarter guidance run rate. The critical question is whether that earnings level is sustainable through the WFE cycle.
Data sources: Lam Research Q4 FY2026 earnings release, official earnings presentation, official earnings-call transcript, Lam Research historical stock-price page, Ultra Clean Holdings Form 10-K, and Micron fiscal Q3 2026 prepared remarks. Market-consensus comparisons reflect published Wall Street estimates available immediately after the release.
Disclaimer: This article/chart is for educational and informational purposes only and does not constitute investment advice of any kind. Past performance is not indicative of future results. Investors should independently evaluate their own risks.