Key Takeaways
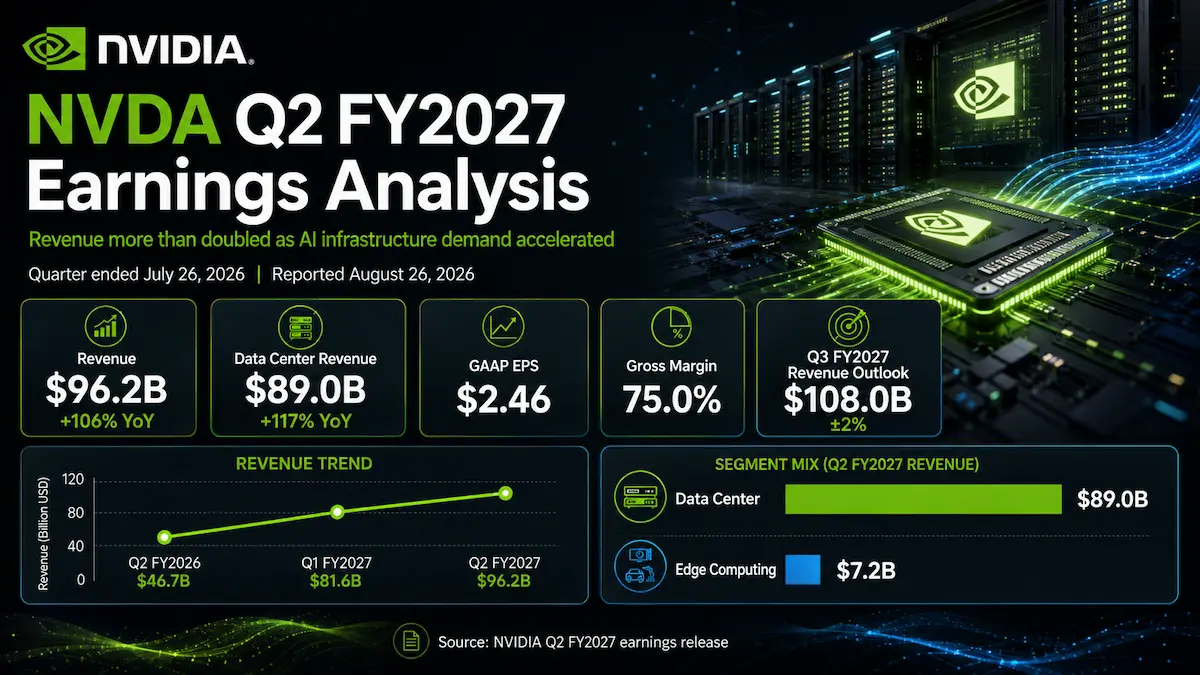
- NVIDIA reported Q2 FY2027 revenue of $96.221 billion, up 106% year over year and 18% sequentially, with Data Center revenue of $89.023 billion rising 117% year over year.
- Non-GAAP diluted EPS reached $2.22 versus the $2.10 LSEG consensus, while revenue beat the $92.17 billion consensus by roughly 4.4%.
- The bigger catalyst was forward visibility: management expects approximately 70% revenue growth in FY2028 and explicitly described that outlook as supply-constrained.
- The principal near-term risk shifted from demand to profitability and execution. Q3 gross margin is guided to 74.0% ± 50 basis points, while management expects gross margin to bottom at roughly 71%-72% in Q4 before settling around 72%-73% in FY2028.
- NVDA closed at $227.98 on August 27, 2026, up 8.74% in the first full session after earnings, showing that investors ultimately valued the multi-year demand and Rubin pipeline more heavily than the near-term margin reset.
1. Core Earnings Breakdown
Revenue and Profitability Analysis
NVIDIA’s fiscal second quarter ended July 26, 2026. Revenue reached $96.221 billion, up 106% from $46.743 billion a year earlier and up 18% from the prior quarter. GAAP gross margin was 75.0%, compared with 72.4% a year ago, while non-GAAP gross margin was also 75.0%. GAAP operating income rose 124% year over year to $63.734 billion and GAAP net income increased 126% to $59.688 billion.
On a non-GAAP basis, operating income was $63.956 billion, net income was $53.954 billion, and diluted EPS was $2.22, up 120% year over year. One accounting nuance matters: beginning in Q1 FY2027, NVIDIA’s non-GAAP measures no longer exclude stock-based compensation, and historical non-GAAP data have been updated to include it. Investors comparing the current adjusted EPS series with older, un-restated third-party figures should therefore check the basis carefully.
Another unusual feature of the quarter is that GAAP EPS of $2.46 exceeded non-GAAP EPS of $2.22. The main reason was $7.8 billion of net gains from equity securities in GAAP other income, which are excluded from NVIDIA’s non-GAAP result. That makes the $2.22 figure the cleaner number for comparing the quarter with Wall Street’s adjusted EPS consensus.
- Data Center revenue was $89.023 billion, up 117% year over year and 18% sequentially. It represented about 92.5% of company revenue, calculated as $89.023 billion divided by $96.221 billion. Investment view: NVIDIA is now overwhelmingly an AI infrastructure company, so the stock’s earnings sensitivity is increasingly tied to AI capital spending, power availability, accelerator supply and the economics of inference rather than traditional gaming cycles.
- Hyperscale revenue was $48.710 billion, up 102% year over year and 13% sequentially. It represented roughly 54.7% of Data Center revenue. Investment view: hyperscalers remain enormous customers, but the slower sequential growth relative to the rest of Data Center is actually constructive because it shows NVIDIA’s growth is no longer dependent on only a handful of mega-cap cloud buyers.
- AI Clouds, Industrial & Enterprise revenue was $40.313 billion, up 138% year over year and 25% sequentially. It represented roughly 45.3% of Data Center revenue. Investment view: this was one of the most important signals in the quarter because NeoClouds, sovereign AI, enterprises and AI-native customers are broadening the demand base and potentially extending the duration of the infrastructure cycle.
- Edge Computing revenue was $7.198 billion, up 27% year over year and 13% sequentially. Investment view: Edge remains much smaller than Data Center, but Blackwell workstation demand is helping offset softer consumer PC demand, giving NVIDIA an additional route to monetize AI outside centralized cloud infrastructure.
- By reportable segment, Compute & Networking revenue was $88.299 billion, up 114% year over year, while Graphics revenue was $7.922 billion, up 46%. Investment view: the mix confirms that networking, rack-scale systems and accelerated compute are becoming as important to the economic model as the standalone GPU itself.
Profitability was exceptionally strong, but investors should not extrapolate the 75% gross margin mechanically. Blackwell Ultra mix supported the quarter, while management used the call to reset future margin expectations because memory pricing has become materially more expensive. The business is simultaneously showing extraordinary pricing power and becoming more exposed to expensive HBM, networking, systems and infrastructure inputs as it sells larger full-stack systems.
Expectations vs. Actual Results
- Total revenue: $96.221 billion actual versus $92.17 billion LSEG consensus. Result: ✅ Beat by approximately $4.05 billion, or 4.4%.
- Non-GAAP diluted EPS: $2.22 actual versus $2.10 LSEG consensus. Result: ✅ Beat by approximately 5.7%.
- Data Center revenue: $89.023 billion actual versus $85.08 billion LSEG consensus. Result: ✅ Beat by approximately 4.6%.
- Non-GAAP operating margin: approximately 66.5%, calculated as $63.956 billion of non-GAAP operating income divided by $96.221 billion of revenue. NVIDIA’s prior Q2 midpoint guide implied roughly 65.9% non-GAAP operating margin, calculated from 75.0% gross margin less $8.3 billion of operating expenses on $91.0 billion of revenue. Result: ✅ Approximately 60 basis points above the company-guide-implied level.
- Q3 FY2027 revenue guidance: $108.0 billion ± 2% versus $104.19 billion LSEG consensus at the time of the release. Result: ✅ Midpoint about 3.7% above consensus.
- Q3 FY2027 gross margin guidance: 74.0% ± 50 basis points versus a 74.77% analyst expectation cited by Reuters. Result: ❌ Midpoint roughly 77 basis points below that expectation.
The true source of the beat was not a single line item. Blackwell Ultra remained strong at hyperscalers, Data Center revenue exceeded expectations, and the non-hyperscaler AI Clouds, Industrial & Enterprise business grew even faster. That matters because it weakens the bear case that NVIDIA’s growth is merely a concentrated capex cycle funded by four or five hyperscalers.
For the market, however, Q2 revenue and EPS were not the most important numbers. NVIDIA had already established a pattern of beating quarterly expectations. The valuation debate had shifted toward three questions: how long AI infrastructure growth can last, whether Vera Rubin can extend the product cycle without an air pocket, and whether margins can survive rising memory and system costs. The call addressed the first two very aggressively and the third more cautiously.
The share-price sequence makes this hierarchy clear. NVIDIA initially fell after the release as investors focused on the weaker-than-expected Q3 gross-margin midpoint. The stock then reversed higher during and after the earnings call as management disclosed approximately 70% FY2028 revenue growth, described that outlook as supply-constrained, laid out a rapid Vera Rubin ramp, and expanded visibility into large customer deployments. The call also disclosed that AWS plans to deploy an additional 2 million NVIDIA GPUs across 2027 and 2028, giving the demand narrative a concrete hyperscale anchor. In the next regular session, NVDA rose 8.74% to close at $227.98. This was not a case of a weak stock reaction despite strong reported results; it was a case where the market first penalized near-term margin pressure and then re-rated the shares upward when the forward demand and product pipeline proved stronger than expected.
NVIDIA’s formal Q3 outlook calls for $108.0 billion of revenue, plus or minus 2%, GAAP and non-GAAP gross margins of 74.0%, plus or minus 50 basis points, GAAP operating expenses of about $9.2 billion and non-GAAP operating expenses of about $9.0 billion. The company assumes no Data Center compute revenue from China in that outlook. For FY2027, NVIDIA expects GAAP and non-GAAP tax rates of 16%-18%, excluding discrete items and material changes to the tax environment.
Earnings Call Highlights
NVIDIA’s Investor Relations site provides the official earnings webcast and CFO commentary rather than a company-hosted verbatim transcript. The strategic points below therefore use accurate paraphrases cross-checked against the official materials and independent transcript records instead of reproducing long transcript passages.
Management expects FY2028 revenue to grow approximately 70%, and explicitly described that outlook as supply-constrained, with demand materially above what the supply chain can currently support.
💡 Reading Between the Lines: This is the single most valuation-relevant disclosure from the call. NVIDIA is telling investors that the limiting factor is not order creation but the ability to secure memory, foundry, packaging, power, land and complete data-center capacity; upside therefore depends on supply unlocks rather than a fresh demand cycle.
Vera Rubin is expected to account for roughly 20% of Data Center revenue in Q3, while hyperscale growth is expected to reaccelerate in Q4 and FY2028 as Rubin supply expands.
💡 Reading Between the Lines: The risk of a major product-transition air pocket appears lower than investors feared. If Rubin becomes a meaningful revenue contributor within one quarter of launch and supply broadens into Q4, the architecture transition can sustain growth rather than interrupt it.
Management said agentic AI workloads can require roughly 15 to 100 times the compute of a human-prompted interaction, depending on the task, because agents reason, plan and use tools across multiple steps.
💡 Reading Between the Lines: NVIDIA’s demand thesis is increasingly about inference intensity, not merely training larger frontier models. If agentic workflows become persistent background processes, token generation becomes a recurring compute-consumption engine that can support a larger infrastructure base than one-time model training alone.
Management reset the margin framework because memory pricing has risen more than expected: Q3 gross margin is guided to 74%, Q4 is expected to bottom near 71%-72%, and FY2028 is expected to settle around 72%-73% after price increases begin to take effect.
💡 Reading Between the Lines: NVIDIA is choosing to protect platform adoption and system economics rather than immediately pass every component increase through to customers. The trade-off is a lower near-term margin floor, so earnings models now need to rely more on volume growth and less on sustained mid-70s gross margins.
Management defended its expanding ecosystem investments, guarantees and customer-support structures as a way to accelerate AI infrastructure that customers want but cannot always finance independently, while arguing that NVIDIA compute remains fungible and redeployable.
💡 Reading Between the Lines: NVIDIA is evolving from a semiconductor vendor into a capital-and-platform orchestrator. That can deepen ecosystem lock-in and create recurring economics beyond hardware sales, but it also introduces credit, concentration and capital-allocation risks that did not matter nearly as much when NVIDIA was simply shipping GPUs into already-funded data centers.
2. Deep Business Insights
Hidden Metrics That Matter
Metric one is cash conversion. Q2 free cash flow was $21.341 billion on $96.221 billion of revenue, equal to a 22.2% free-cash-flow margin, calculated from company-reported figures as $21.341 billion divided by $96.221 billion. In Q1, free cash flow was $48.554 billion on $81.615 billion of revenue, equal to a 59.5% margin. The quarter-over-quarter decline was therefore about 37.3 percentage points, calculated from company-reported figures.
This does not mean the income statement suddenly became low quality. NVIDIA explained that operating cash flow fell sequentially because of higher working-capital adjustments and cash taxes. More importantly, days sales outstanding increased to 60 days from 45 days because of extended payment terms on large, multi-quarter agreements with certain investment-grade customers. That combination is strategically important: as NVIDIA sells larger rack-scale systems and supports bigger infrastructure deployments, revenue can grow faster than near-term cash collection. Investors should therefore track DSO, receivables, customer financing structures and free-cash-flow conversion alongside revenue growth.
Metric two is the amount of revenue NVIDIA can capture per unit of scarce data-center power. Management said its revenue opportunity rose from roughly $18 billion per gigawatt in the Hopper era to about $25 billion with Grace Blackwell and approximately $40 billion with Vera Rubin. On that basis, Vera Rubin represents about 2.22 times the revenue opportunity per gigawatt of Hopper, calculated from company-reported call figures as $40 billion divided by $18 billion.
This helps explain why customers continue to choose NVIDIA even as custom accelerators and competing GPUs improve. The moat is not simply peak chip performance. NVIDIA combines GPUs, CPUs, NVLink scale-up networking, Ethernet or InfiniBand scale-out networking, systems, CUDA software and deployment tooling into a full-stack AI factory. That reduces integration complexity, improves portability across clouds and workloads, and allows customers to extract more compute from constrained power and physical space. Management also claims Vera Rubin delivers sharply higher throughput per megawatt and lower token cost than the prior generation; those are company performance claims rather than independently audited financial metrics, but they illustrate the economic value proposition NVIDIA is selling.
There is also a hidden balance-sheet dimension. Supply and capacity commitments rose from $119 billion in the prior quarter to $279 billion, primarily related to memory. NVIDIA separately disclosed $366 billion of future commitments across supply, cloud agreements, leases, equity investments and capital expenditures, another $56 billion of additional AI-cloud and third-party lease commitments, and maximum gross guarantee exposure of $108.5 billion including the August SB Energy arrangement. Adding those disclosed categories gives $530.5 billion as a scale indicator, calculated from company-reported figures as $366 billion + $56 billion + $108.5 billion. This is not a GAAP liability total and should not be treated as one: the categories differ in timing, contingency, expected reassignment and economic substance. But it shows how aggressively NVIDIA is using its balance sheet and purchasing power to secure the infrastructure required for the next phase of growth.
Industry Chain Reactions
- ✅ Benefit — Micron Technology (MU): NVIDIA said its $279 billion of supply and capacity commitments are primarily related to memory, and management described current memory pricing conditions as extreme. Micron has separately confirmed that its HBM4 is in high-volume production and designed for NVIDIA Vera Rubin. The implication is favorable for HBM demand, utilization and pricing, although memory cyclicality and customer concentration remain important risks for Micron.
- ❌ Face Pressure — Advanced Micro Devices (AMD): AMD still has a large opportunity because the AI accelerator market is expanding rapidly, but NVIDIA’s results raise the competitive bar. A supply-constrained 70% FY2028 growth outlook, rapid Rubin ramp, broader NeoCloud and sovereign adoption, and an increasingly complete CPU-networking-GPU software stack make it harder for competing accelerators to win solely on chip-level price or benchmark performance. AMD can grow and still lose relative platform share if NVIDIA captures more system-level dollars per data-center deployment.
Valuation Framework and Key Risks
Using the August 27, 2026 regular-session close of $227.98 as the current price reference, Reuters reported during that session that NVIDIA was trading at approximately 17.9 times forward earnings. In isolation, that multiple does not look extreme for a company guiding to approximately 70% revenue growth in FY2028. The catch is that the earnings denominator already assumes an extraordinary level of execution, and the margin framework is moving in the wrong direction before price increases take effect.
The valuation debate should therefore be framed around earnings durability rather than whether 17.9 times is optically cheap. At the Q3 revenue midpoint of $108 billion, every 100 basis points of gross margin is worth roughly $1.08 billion of quarterly gross profit, calculated as $108 billion multiplied by 1%. A move from a 75% gross margin toward 72%-73% is economically meaningful even if revenue continues to grow rapidly.
The bull case is that supply constraints ease faster than assumed, allowing NVIDIA to capture more of the demand that management says is materially above its 70% growth outlook. In that scenario, Rubin scales quickly, AI Clouds, Industrial & Enterprise remain near half of Data Center demand, and lower gross margins are overwhelmed by revenue and operating-income growth.
The base case is that NVIDIA delivers roughly the 70% FY2028 growth framework, gross margin stabilizes in the 72%-73% range, and the stock’s return becomes increasingly dependent on EPS delivery rather than continued multiple expansion. This would still be an exceptional operating outcome, but it would leave less room for execution mistakes because the absolute revenue and capital commitments are so large.
The bear case is no longer simply that AI demand disappears. A more realistic bear case is that memory, packaging, power and land constraints keep NVIDIA from converting demand into shipments while input costs remain elevated; at the same time, customer financing and guarantee exposure increases, custom silicon captures selected inference workloads, and gross margin falls below management’s new floor. In that environment, both the earnings denominator and the valuation multiple could compress together.
- Margin risk: memory inflation has already forced management to reset Q4 and FY2028 gross-margin expectations lower.
- Supply-chain execution risk: management says the entire supply chain is challenged, not just one component category.
- Capital-allocation and credit risk: large commitments, guarantees, equity investments and customer-support structures can accelerate demand, but they also increase financial complexity and scrutiny around circular financing.
- China and geopolitical risk: Q2 Data Center Hopper shipments to China were less than 1% of Data Center revenue, and the Q3 outlook assumes no China Data Center compute revenue.
- Competition risk: hyperscalers and frontier labs are developing custom silicon, while AMD and other vendors are competing for accelerator, CPU and networking workloads. NVIDIA’s platform lead must continue to translate into superior customer economics.
- Concentration risk: with Data Center at roughly 92.5% of total revenue, any slowdown in AI infrastructure investment would have a much larger effect on consolidated results than gaming weakness did in NVIDIA’s earlier business model.
3. Key FAQs
Did NVIDIA beat Q2 2027 earnings estimates?
Yes. NVIDIA reported Q2 FY2027 revenue of $96.221 billion versus an LSEG consensus of $92.17 billion, a beat of about 4.4%. Non-GAAP diluted EPS was $2.22 versus $2.10 expected, a beat of about 5.7%. Data Center revenue of $89.023 billion also exceeded the $85.08 billion LSEG consensus. The more important surprise, however, came from the earnings call: management expects roughly 70% revenue growth in FY2028, materially above pre-report Wall Street growth expectations.
What is NVIDIA’s Q3 FY2027 revenue and gross margin guidance?
NVIDIA expects Q3 FY2027 revenue of $108.0 billion, plus or minus 2%. GAAP and non-GAAP gross margins are expected to be 74.0%, plus or minus 50 basis points. GAAP operating expenses are expected to be approximately $9.2 billion and non-GAAP operating expenses approximately $9.0 billion. NVIDIA’s outlook assumes no Data Center compute revenue from China. On the call, management also said gross margin is expected to bottom around 71%-72% in Q4 before settling near 72%-73% in FY2028 as price increases take effect.
Is NVDA stock expensive after Q2 2027 earnings?
Using the August 27 close of $227.98 as the current price reference, Reuters cited a forward P/E of roughly 17.9 times during that post-earnings session. That multiple can look modest relative to NVIDIA’s approximately 70% FY2028 revenue-growth outlook, but investors should not evaluate it without the margin and capital-intensity reset. The key valuation question is whether NVIDIA can convert supply-constrained demand into shipments fast enough to offset lower gross margins, rising working-capital needs and larger ecosystem commitments. If it can, the earnings denominator can grow rapidly; if it cannot, the apparent valuation discount can disappear quickly.
Primary sources: NVIDIA Q2 FY2027 earnings release, official CFO commentary, official earnings webcast page, NVIDIA Q1 FY2027 results and prior Q2 guidance, independent Q2 FY2027 transcript record, Reuters/LSEG consensus reporting, and S&P Global Visible Alpha pre-earnings consensus analysis.
Disclaimer: This article/chart is for educational and informational purposes only and does not constitute investment advice of any kind. Past performance is not indicative of future results. Investors should independently evaluate their own risks.