⚡ Key Takeaways
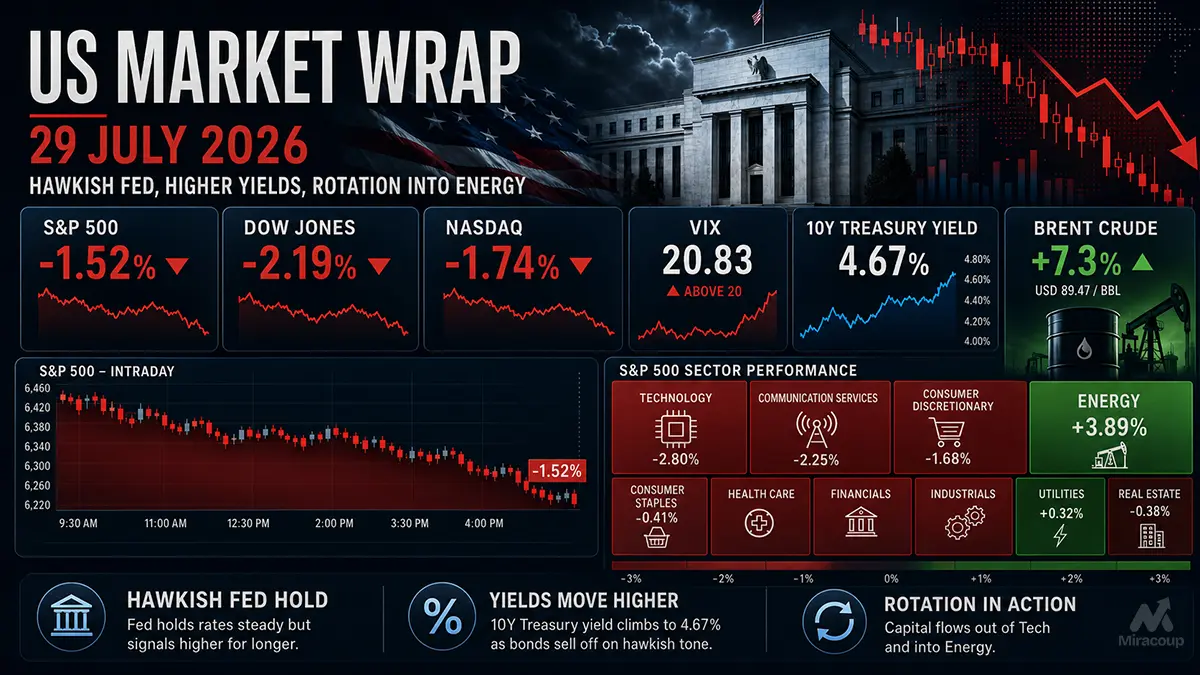
- The S&P 500 fell 1.52% to 7,316.15, the Dow Jones Industrial Average lost 2.19% to 51,594.14, and the Nasdaq Composite declined 1.74% to 24,442.94 as investors reduced exposure to AI-linked and economically sensitive stocks.
- The Federal Reserve held its policy rate at 3.50%-3.75% by a 9-3 vote, with three officials preferring a 25-basis-point increase. The unusually hawkish split reinforced concerns that persistent energy inflation could delay monetary easing or revive rate-hike risk.
- Energy led the market as Brent crude surged 7.3% and settled above $88 per barrel. Industrials dropped 3.24%, while information technology fell 2.5%, reflecting a rotation from long-duration growth assets toward oil-linked cash flows.
1. Market Capital Flows
Energy was the session’s clear relative winner as renewed Middle East risk lifted crude prices and restored the sector’s value as an inflation hedge. In contrast, industrials recorded the largest sector decline, falling 3.24%, followed by a 2.5% drop in information technology.
The selling was broad enough to signal institutional de-risking rather than isolated profit-taking. Declining S&P 500 stocks outnumbered advancing stocks by 1.8 to one, while approximately 17.7 billion shares changed hands, slightly above the prior 20-session average.
Capital-flow logic: The market repriced two risks simultaneously: higher input costs and a rising discount rate for long-dated earnings. Energy companies offered immediate sensitivity to higher commodity prices, while AI infrastructure, semiconductor and capital-goods stocks faced scrutiny over elevated spending, margin pressure and uncertain near-term returns on investment.
2. Decoding Market Movers
Meta Platforms (NASDAQ: META)
Meta fell approximately 4% in extended trading immediately after its earnings release. Second-quarter revenue increased 28% year over year to $60.80 billion, but diluted EPS declined 13% to $6.18. Operating margin compressed to 31% from 43%, while free cash flow fell to just $784 million as quarterly capital expenditure reached $31.08 billion.
Management guided for third-quarter revenue of $61 billion to $64 billion and narrowed its 2026 capital-expenditure outlook to $130 billion-$145 billion from $125 billion-$145 billion. Raising the lower end of that range mattered more than the strong advertising growth: investors interpreted it as confirmation that Meta’s AI buildout will continue consuming a larger share of near-term cash generation.
Microsoft (NASDAQ: MSFT)
Microsoft edged about 0.6% higher in extended trading after reporting fiscal fourth-quarter revenue of $90.0 billion, up 18%, and GAAP diluted EPS of $4.81, up 32%. Microsoft Cloud revenue increased 27% to $59.3 billion, Azure revenue rose 43%, and commercial remaining performance obligations climbed 84% to $678 billion.
The earnings call provided stronger evidence of AI monetization than many investors had feared. Management expects Azure growth of approximately 45% in constant currency during the next quarter and guided total revenue to $89.85 billion-$90.95 billion. However, projected first-quarter capital expenditure of more than $50 billion means Microsoft remains exposed to execution risk, infrastructure costs and further cloud-margin pressure.
3. Macro Indicators & Market Outlook
The Cboe Volatility Index, or VIX, rose sharply and briefly moved above 20 as demand for downside protection increased. Treasury trading produced a pronounced long-end steepening: the two-year yield declined four basis points to 4.22%, while the 10-year yield rose six basis points to 4.67% and the 30-year yield jumped 11 basis points to 5.20%.
This curve movement was particularly unfavorable for equities. A softer two-year yield suggested limited conviction in immediate tightening, but rising 10- and 30-year yields showed that investors were demanding greater compensation for inflation, fiscal and duration risk.
Upcoming Economic Data & Outlook:
The next releases will test whether the economy can sustain solid growth without generating another inflation impulse.
- Q2 2026 GDP — Advance Estimate (July 30, 2026, 8:30 a.m. ET)
- June Personal Income and Outlays, including PCE inflation (July 30, 2026, 8:30 a.m. ET)
Market Insights:
A durable market reversal will likely require stabilization in long-term Treasury yields or evidence that the oil shock will not feed into broader inflation. A resilient GDP report combined with sticky PCE inflation could intensify the long-end bond selloff and pressure richly valued growth stocks. Additional risks include geopolitical escalation, renewed expectations for a Fed rate increase and further margin compression among companies funding aggressive AI expansion.
Trading & Investment Strategy:
Maintain selective exposure rather than treating the selloff as an indiscriminate buying opportunity. Favor companies with visible free cash flow, pricing power and demonstrable AI monetization. Energy can provide a tactical hedge against commodity inflation, while oversized positions in high-duration, capital-intensive technology names should be reviewed. Staggered entries and disciplined position sizing remain preferable while the VIX and long-term yields are elevated.
4. Key FAQs
Why did the US stock market fall after the Fed held rates steady on July 29, 2026?
Stocks declined because three Fed officials favored a rate increase, making the unchanged decision more hawkish than the headline suggested. Rising oil prices and higher long-term Treasury yields also increased inflation and valuation risks.
Why did energy stocks outperform technology stocks on July 29, 2026?
Energy benefited directly from the 7.3% surge in Brent crude, while technology stocks faced higher discount rates and growing concern over the free-cash-flow impact of AI infrastructure spending.
What should investors watch after the July 29, 2026 US market selloff?
The most important signals are the upcoming GDP and PCE inflation releases, movements in the 10- and 30-year Treasury yields, oil prices, VIX behavior and management commentary on AI capital expenditure and cash returns.
Disclaimer: This article is intended solely for the exchange of investment ideas and does not constitute investment advice of any kind.